29
/
en
AIzaSyAYiBZKx7MnpbEhh9jyipgxe19OcubqV5w
April 1, 2024
134654
France
FRA
true
2
1
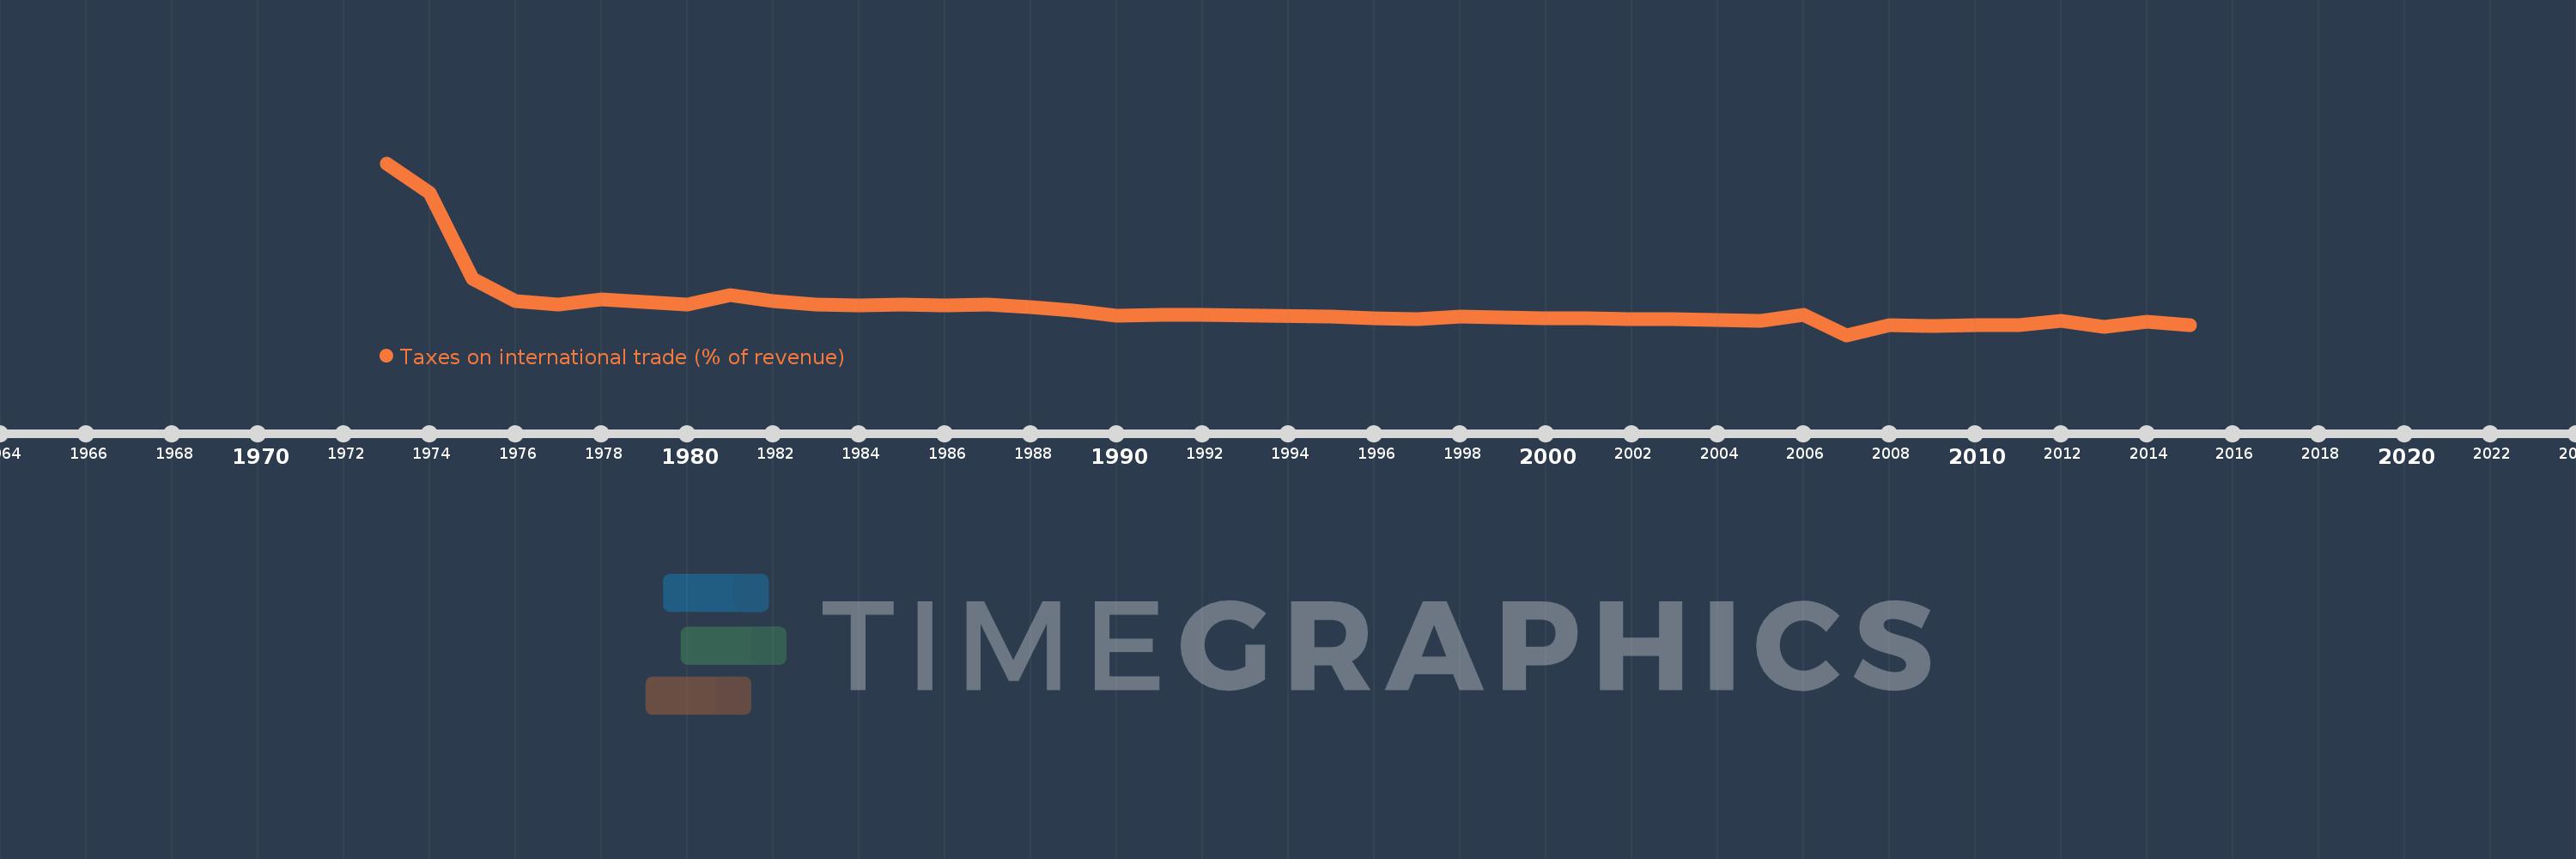
Taxes on international trade (% of revenue)
2015,2014,2013,2012,2011,2010,2009,2008,2007,2006,2005,2004,2003,2002,2001,2000,1999,1998,1997,1996,1995,1992,1991,1990,1989,1988,1987,1986,1985,1984,1983,1982,1981,1980,1979,1978,1977,1976,1975,1974,1973
This statistics in other country:
AfghanistanAlbaniaAlgeriaAngolaAntigua and BarbudaArab WorldArgentinaArmeniaAustraliaAustriaAzerbaijanBahamas, TheBahrainBangladeshBarbadosBelarusBelizeBeninBhutanBoliviaBosnia and HerzegovinaBotswanaBrazilBulgariaBurkina FasoBurundiCabo VerdeCambodiaCanadaCaribbean small statesCentral African RepublicCentral Europe and the BalticsChileChinaColombiaCongo, Dem. Rep.Congo, Rep.Costa RicaCote d'IvoireCroatiaCyprusCzech RepublicDenmarkDominicaDominican RepublicEarly-demographic dividendEast Asia & PacificEast Asia & Pacific (excluding high income)East Asia & Pacific (IDA & IBRD countries)Egypt, Arab Rep.El SalvadorEquatorial GuineaEstoniaEthiopiaEuro areaEurope & Central AsiaEurope & Central Asia (excluding high income)Europe & Central Asia (IDA & IBRD countries)European UnionFijiFinlandFranceGambia, TheGeorgiaGermanyGhanaGreeceGrenadaGuatemalaHeavily indebted poor countries (HIPC)High incomeHondurasHong Kong SAR, ChinaHungaryIBRD onlyIcelandIDA & IBRD totalIDA blendIDA onlyIDA totalIndiaIndonesiaIran, Islamic Rep.IraqIrelandIsraelItalyJamaicaJapanJordanKazakhstanKenyaKiribatiKorea, Rep.KuwaitKyrgyz RepublicLao PDRLate-demographic dividendLatin America & Caribbean Latin America & Caribbean (excluding high income)Latin America & the Caribbean (IDA & IBRD countries)LatviaLeast developed countries: UN classificationLebanonLesothoLiberiaLithuaniaLow & middle incomeLow incomeLower middle incomeLuxembourgMacedonia, FYRMadagascarMalawiMalaysiaMaldivesMaliMaltaMauritiusMexicoMicronesia, Fed. Sts.Middle East & North AfricaMiddle East & North Africa (excluding high income)Middle East & North Africa (IDA & IBRD countries)Middle incomeMoldovaMongoliaMoroccoMozambiqueMyanmarNamibiaNepalNetherlandsNew ZealandNicaraguaNorth AmericaNorwayOECD membersOmanOther small statesPakistanPanamaPapua New GuineaParaguayPeruPhilippinesPolandPortugalPost-demographic dividendPre-demographic dividendQatarRomaniaRussian FederationRwandaSamoaSan MarinoSao Tome and PrincipeSenegalSerbiaSeychellesSierra LeoneSingaporeSlovak RepublicSloveniaSmall statesSolomon IslandsSouth AfricaSouth AsiaSouth Asia (IDA & IBRD)SpainSri LankaSt. Kitts and NevisSt. LuciaSub-Saharan Africa Sub-Saharan Africa (excluding high income)Sub-Saharan Africa (IDA & IBRD countries)SurinameSwazilandSwedenSwitzerlandSyrian Arab RepublicTajikistanTanzaniaThailandTimor-LesteTogoTrinidad and TobagoTunisiaTurkeyUgandaUkraineUnited Arab EmiratesUnited KingdomUnited StatesUpper middle incomeUruguayVanuatuVenezuela, RBVietnamWest Bank and GazaWorldYemen, Rep.ZambiaZimbabwe Timeline:
This timeline shows a graph from 1973 to 2015 of France. No data until 1972. Number of actual observations by date: 41.
Source name:
World Development Indicators
Source organization:
International Monetary Fund, Government Finance Statistics Yearbook and data files.
Categories, topics:
Public Sector
Last updated:
apr 23, 2017
Indicators value changes by year
Minimum:
-0.032
jan 1, 2007
At the date of observation
Value
Absolute change
Change from previous value
jan 1, 1973
0.33
+0.33
0.0%
jan 1, 1974
0.268
-0.061
-18.62%
jan 1, 1975
0.087
-0.181
-67.4%
jan 1, 1976
0.039
-0.049
-55.7%
jan 1, 1977
0.032
-0.007
-17.74%
jan 1, 1978
0.043
+0.011
34.72%
jan 1, 1979
0.038
-0.005
-11.88%
jan 1, 1980
0.032
-0.006
-15.81%
jan 1, 1981
0.053
+0.022
67.59%
jan 1, 1982
0.039
-0.015
-27.24%
jan 1, 1983
0.033
-0.005
-13.92%
jan 1, 1984
0.03
-0.004
-10.56%
jan 1, 1985
0.033
+0.003
9.37%
jan 1, 1986
0.03
-0.002
-7.29%
jan 1, 1987
0.033
+0.003
9.92%
jan 1, 1988
0.026
-0.007
-20.93%
jan 1, 1989
0.019
-0.008
-28.59%
jan 1, 1990
0.008
-0.011
-56.85%
jan 1, 1991
0.011
+0.003
37.77%
jan 1, 1992
0.01
-0.001
-9.89%
jan 1, 1995
0.007
-0.003
-34.56%
jan 1, 1996
0.004
-0.003
-39.03%
jan 1, 1997
0.002
-0.002
-54.77%
jan 1, 1998
0.007
+0.005
277.93%
jan 1, 1999
0.006
0.0
-5.88%
jan 1, 2000
0.004
-0.003
-39.78%
jan 1, 2001
0.003
-0.001
-23.46%
jan 1, 2002
0.001
-0.002
-64.83%
jan 1, 2003
0.001
0.0
-29.81%
jan 1, 2004
-0.001
-0.001
-198.38%
jan 1, 2005
-0.002
-0.001
110.91%
jan 1, 2006
0.01
+0.011
-733.82%
jan 1, 2007
-0.032
-0.042
-430.31%
jan 1, 2008
-0.012
+0.02
-62.82%
jan 1, 2009
-0.013
-0.001
8.41%
jan 1, 2010
-0.012
+0.001
-7.01%
jan 1, 2011
-0.012
-0.001
4.29%
jan 1, 2012
-0.002
+0.011
-84.63%
jan 1, 2013
-0.014
-0.012
614.81%
jan 1, 2014
-0.004
+0.01
-70.86%
jan 1, 2015
-0.012
-0.008
199.52%
Ranking of countries by current statistics by years


Comments: