29
/
en
AIzaSyAYiBZKx7MnpbEhh9jyipgxe19OcubqV5w
April 1, 2024
189686
Maldives
MDV
true
2
1
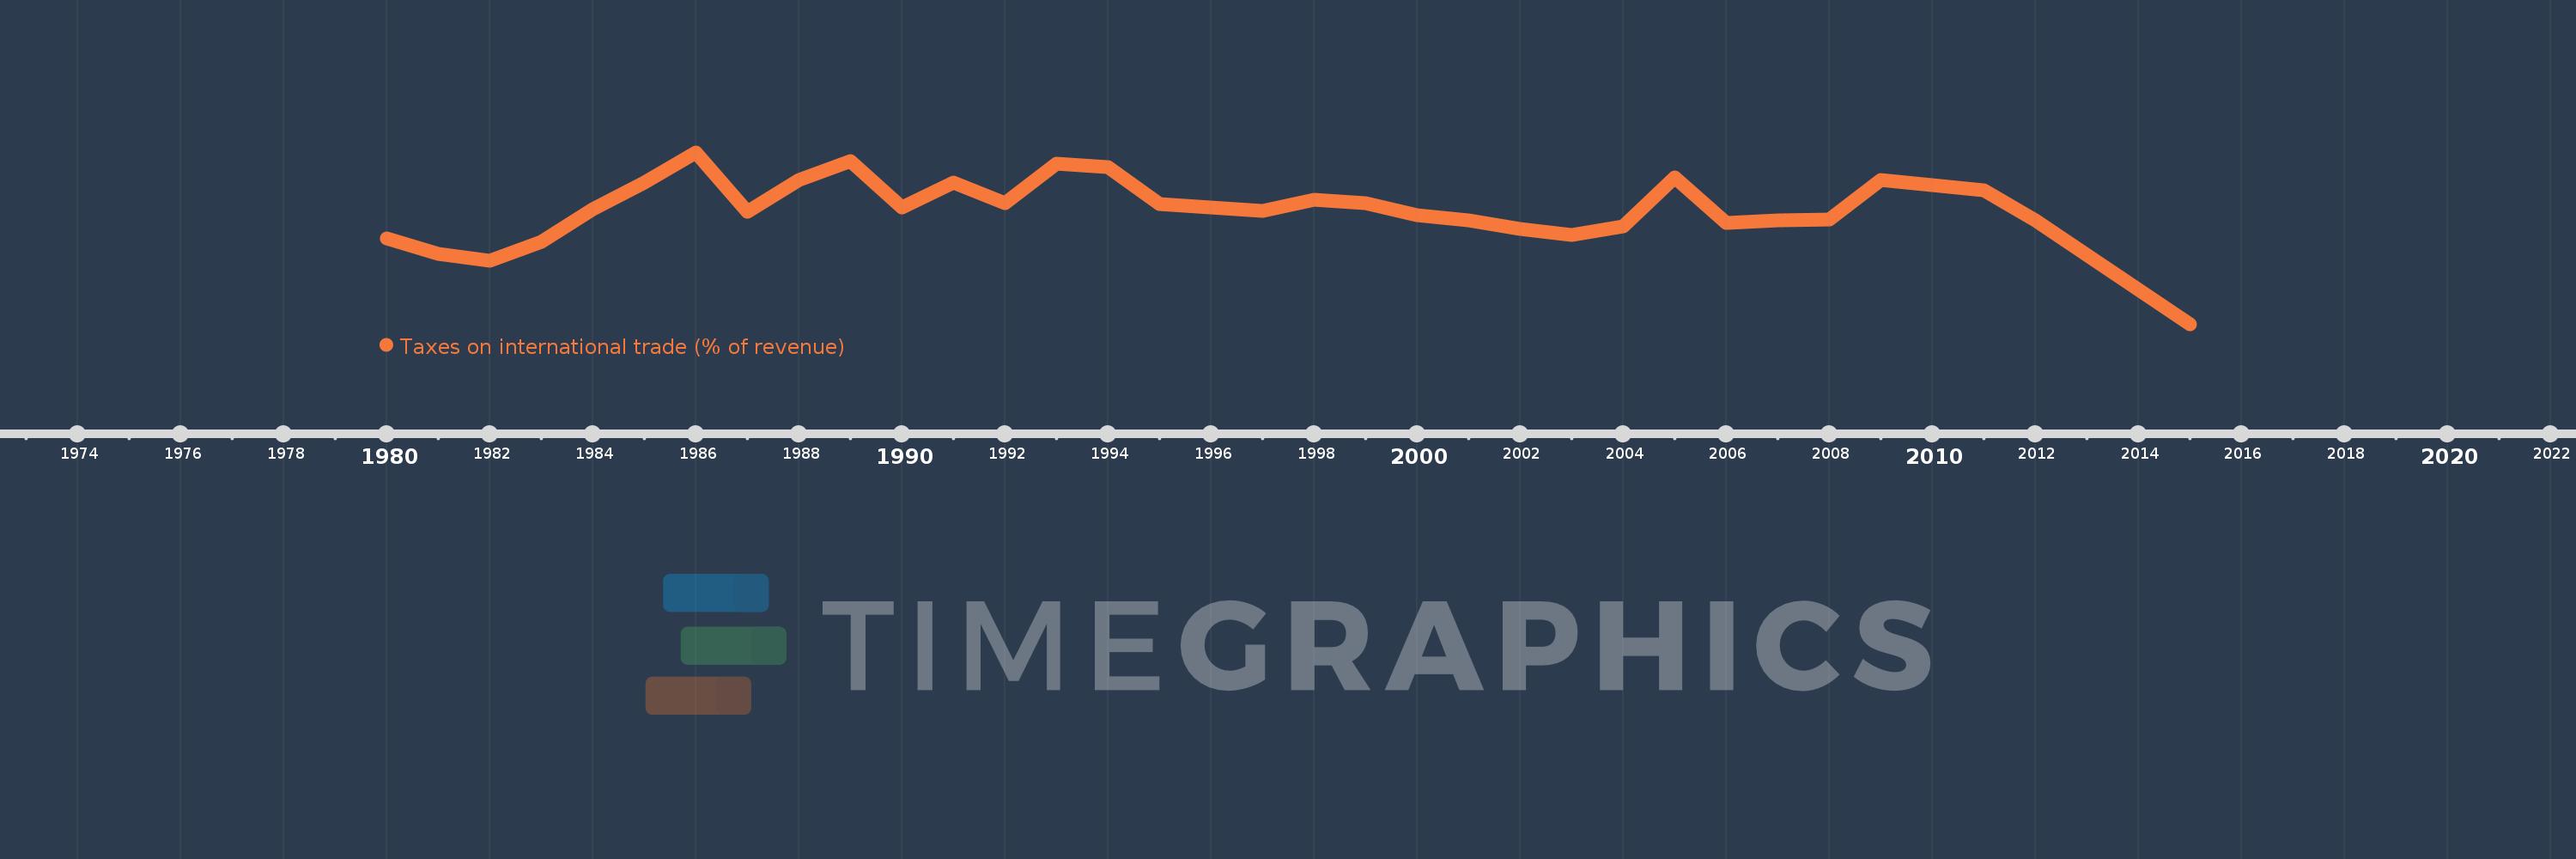
Taxes on international trade (% of revenue)
2015,2012,2011,2010,2009,2008,2007,2006,2005,2004,2003,2002,2001,2000,1999,1998,1997,1996,1995,1994,1993,1992,1991,1990,1989,1988,1987,1986,1985,1984,1983,1982,1981,1980
This statistics in other country:
AfghanistanAlbaniaAlgeriaAngolaAntigua and BarbudaArab WorldArgentinaArmeniaAustraliaAustriaAzerbaijanBahamas, TheBahrainBangladeshBarbadosBelarusBelizeBeninBhutanBoliviaBosnia and HerzegovinaBotswanaBrazilBulgariaBurkina FasoBurundiCabo VerdeCambodiaCanadaCaribbean small statesCentral African RepublicCentral Europe and the BalticsChileChinaColombiaCongo, Dem. Rep.Congo, Rep.Costa RicaCote d'IvoireCroatiaCyprusCzech RepublicDenmarkDominicaDominican RepublicEarly-demographic dividendEast Asia & PacificEast Asia & Pacific (excluding high income)East Asia & Pacific (IDA & IBRD countries)Egypt, Arab Rep.El SalvadorEquatorial GuineaEstoniaEthiopiaEuro areaEurope & Central AsiaEurope & Central Asia (excluding high income)Europe & Central Asia (IDA & IBRD countries)European UnionFijiFinlandFranceGambia, TheGeorgiaGermanyGhanaGreeceGrenadaGuatemalaHeavily indebted poor countries (HIPC)High incomeHondurasHong Kong SAR, ChinaHungaryIBRD onlyIcelandIDA & IBRD totalIDA blendIDA onlyIDA totalIndiaIndonesiaIran, Islamic Rep.IraqIrelandIsraelItalyJamaicaJapanJordanKazakhstanKenyaKiribatiKorea, Rep.KuwaitKyrgyz RepublicLao PDRLate-demographic dividendLatin America & Caribbean Latin America & Caribbean (excluding high income)Latin America & the Caribbean (IDA & IBRD countries)LatviaLeast developed countries: UN classificationLebanonLesothoLiberiaLithuaniaLow & middle incomeLow incomeLower middle incomeLuxembourgMacedonia, FYRMadagascarMalawiMalaysiaMaldivesMaliMaltaMauritiusMexicoMicronesia, Fed. Sts.Middle East & North AfricaMiddle East & North Africa (excluding high income)Middle East & North Africa (IDA & IBRD countries)Middle incomeMoldovaMongoliaMoroccoMozambiqueMyanmarNamibiaNepalNetherlandsNew ZealandNicaraguaNorth AmericaNorwayOECD membersOmanOther small statesPakistanPanamaPapua New GuineaParaguayPeruPhilippinesPolandPortugalPost-demographic dividendPre-demographic dividendQatarRomaniaRussian FederationRwandaSamoaSan MarinoSao Tome and PrincipeSenegalSerbiaSeychellesSierra LeoneSingaporeSlovak RepublicSloveniaSmall statesSolomon IslandsSouth AfricaSouth AsiaSouth Asia (IDA & IBRD)SpainSri LankaSt. Kitts and NevisSt. LuciaSub-Saharan Africa Sub-Saharan Africa (excluding high income)Sub-Saharan Africa (IDA & IBRD countries)SurinameSwazilandSwedenSwitzerlandSyrian Arab RepublicTajikistanTanzaniaThailandTimor-LesteTogoTrinidad and TobagoTunisiaTurkeyUgandaUkraineUnited Arab EmiratesUnited KingdomUnited StatesUpper middle incomeUruguayVanuatuVenezuela, RBVietnamWest Bank and GazaWorldYemen, Rep.ZambiaZimbabwe Timeline:
This timeline shows a graph from 1980 to 2015 of Maldives. No data until 1979. Number of actual observations by date: 34.
Source name:
World Development Indicators
Source organization:
International Monetary Fund, Government Finance Statistics Yearbook and data files.
Categories, topics:
Public Sector
Last updated:
apr 23, 2017
Indicators value changes by year
Minimum:
13.456
jan 1, 2015
Maximum:
36.776
jan 1, 1986
At the date of observation
Value
Absolute change
Change from previous value
jan 1, 1980
25.105
+25.105
0.0%
jan 1, 1981
22.982
-2.122
-8.45%
jan 1, 1982
22.055
-0.927
-4.03%
jan 1, 1983
24.61
+2.555
11.58%
jan 1, 1984
29.032
+4.422
17.97%
jan 1, 1985
32.661
+3.628
12.5%
jan 1, 1986
36.776
+4.115
12.6%
jan 1, 1987
28.688
-8.088
-21.99%
jan 1, 1988
33.081
+4.393
15.31%
jan 1, 1989
35.637
+2.556
7.73%
jan 1, 1990
29.335
-6.301
-17.68%
jan 1, 1991
32.716
+3.38
11.52%
jan 1, 1992
29.827
-2.888
-8.83%
jan 1, 1993
35.275
+5.448
18.26%
jan 1, 1994
34.816
-0.459
-1.3%
jan 1, 1995
29.791
-5.025
-14.43%
jan 1, 1996
29.281
-0.51
-1.71%
jan 1, 1997
28.808
-0.473
-1.62%
jan 1, 1998
30.37
+1.562
5.42%
jan 1, 1999
29.9
-0.47
-1.55%
jan 1, 2000
28.294
-1.606
-5.37%
jan 1, 2001
27.553
-0.741
-2.62%
jan 1, 2002
26.405
-1.149
-4.17%
jan 1, 2003
25.535
-0.87
-3.29%
jan 1, 2004
26.699
+1.164
4.56%
jan 1, 2005
33.37
+6.67
24.98%
jan 1, 2006
27.211
-6.158
-18.46%
jan 1, 2007
27.585
+0.374
1.37%
jan 1, 2008
27.692
+0.107
0.39%
jan 1, 2009
33.029
+5.337
19.27%
jan 1, 2010
32.317
-0.712
-2.16%
jan 1, 2011
31.639
-0.677
-2.1%
jan 1, 2012
27.604
-4.036
-12.76%
jan 1, 2015
13.456
-14.147
-51.25%
Ranking of countries by current statistics by years


Comments: