29
/
en
AIzaSyAYiBZKx7MnpbEhh9jyipgxe19OcubqV5w
April 1, 2024
36234
High income
HIC
false
2
1
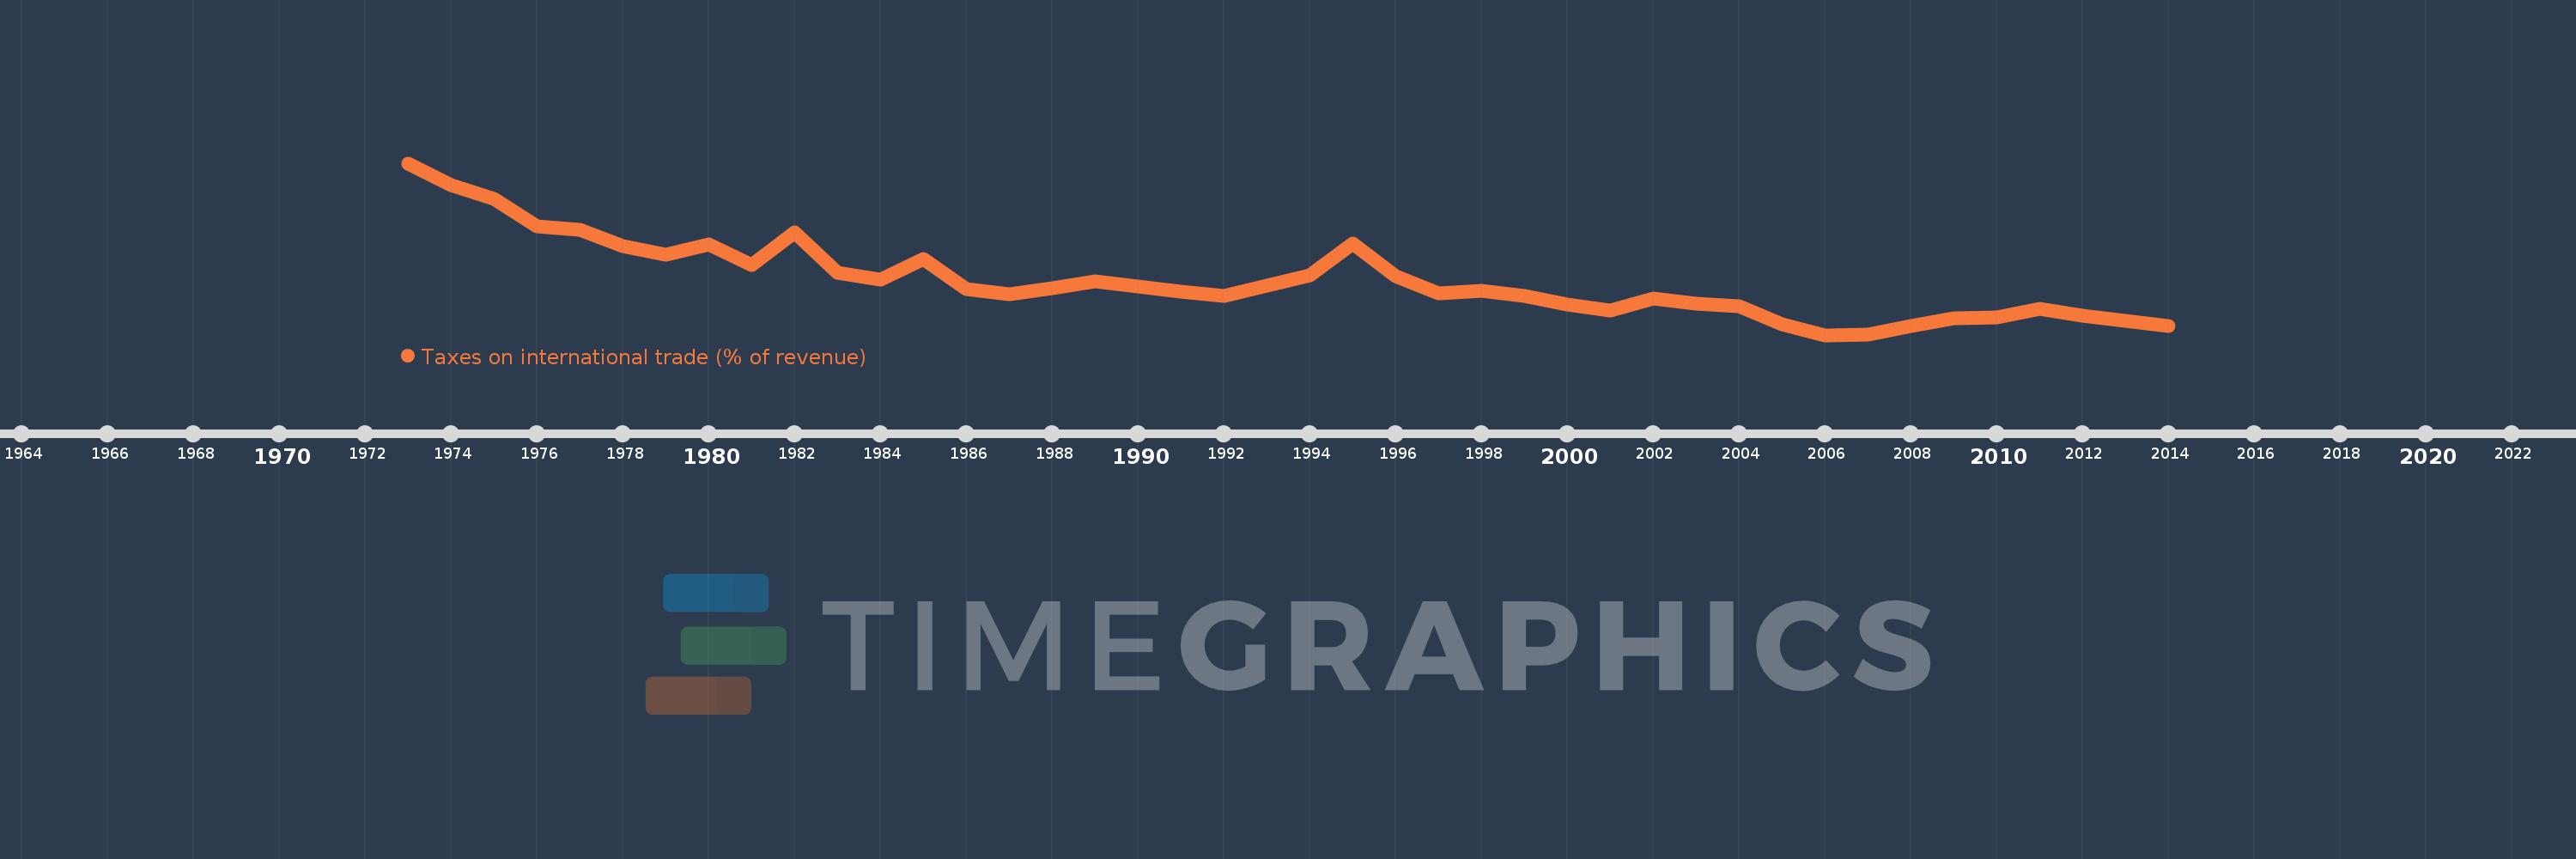
Taxes on international trade (% of revenue)
2014,2013,2012,2011,2010,2009,2008,2007,2006,2005,2004,2003,2002,2001,2000,1999,1998,1997,1996,1995,1994,1992,1991,1989,1988,1987,1986,1985,1984,1983,1982,1981,1980,1979,1978,1977,1976,1975,1974,1973
This statistics in other country:
AfghanistanAlbaniaAlgeriaAngolaAntigua and BarbudaArab WorldArgentinaArmeniaAustraliaAustriaAzerbaijanBahamas, TheBahrainBangladeshBarbadosBelarusBelizeBeninBhutanBoliviaBosnia and HerzegovinaBotswanaBrazilBulgariaBurkina FasoBurundiCabo VerdeCambodiaCanadaCaribbean small statesCentral African RepublicCentral Europe and the BalticsChileChinaColombiaCongo, Dem. Rep.Congo, Rep.Costa RicaCote d'IvoireCroatiaCyprusCzech RepublicDenmarkDominicaDominican RepublicEarly-demographic dividendEast Asia & PacificEast Asia & Pacific (excluding high income)East Asia & Pacific (IDA & IBRD countries)Egypt, Arab Rep.El SalvadorEquatorial GuineaEstoniaEthiopiaEuro areaEurope & Central AsiaEurope & Central Asia (excluding high income)Europe & Central Asia (IDA & IBRD countries)European UnionFijiFinlandFranceGambia, TheGeorgiaGermanyGhanaGreeceGrenadaGuatemalaHeavily indebted poor countries (HIPC)High incomeHondurasHong Kong SAR, ChinaHungaryIBRD onlyIcelandIDA & IBRD totalIDA blendIDA onlyIDA totalIndiaIndonesiaIran, Islamic Rep.IraqIrelandIsraelItalyJamaicaJapanJordanKazakhstanKenyaKiribatiKorea, Rep.KuwaitKyrgyz RepublicLao PDRLate-demographic dividendLatin America & Caribbean Latin America & Caribbean (excluding high income)Latin America & the Caribbean (IDA & IBRD countries)LatviaLeast developed countries: UN classificationLebanonLesothoLiberiaLithuaniaLow & middle incomeLow incomeLower middle incomeLuxembourgMacedonia, FYRMadagascarMalawiMalaysiaMaldivesMaliMaltaMauritiusMexicoMicronesia, Fed. Sts.Middle East & North AfricaMiddle East & North Africa (excluding high income)Middle East & North Africa (IDA & IBRD countries)Middle incomeMoldovaMongoliaMoroccoMozambiqueMyanmarNamibiaNepalNetherlandsNew ZealandNicaraguaNorth AmericaNorwayOECD membersOmanOther small statesPakistanPanamaPapua New GuineaParaguayPeruPhilippinesPolandPortugalPost-demographic dividendPre-demographic dividendQatarRomaniaRussian FederationRwandaSamoaSan MarinoSao Tome and PrincipeSenegalSerbiaSeychellesSierra LeoneSingaporeSlovak RepublicSloveniaSmall statesSolomon IslandsSouth AfricaSouth AsiaSouth Asia (IDA & IBRD)SpainSri LankaSt. Kitts and NevisSt. LuciaSub-Saharan Africa Sub-Saharan Africa (excluding high income)Sub-Saharan Africa (IDA & IBRD countries)SurinameSwazilandSwedenSwitzerlandSyrian Arab RepublicTajikistanTanzaniaThailandTimor-LesteTogoTrinidad and TobagoTunisiaTurkeyUgandaUkraineUnited Arab EmiratesUnited KingdomUnited StatesUpper middle incomeUruguayVanuatuVenezuela, RBVietnamWest Bank and GazaWorldYemen, Rep.ZambiaZimbabwe Timeline:
This timeline shows a graph from 1973 to 2014 of High income. No data until 1972. Number of actual observations by date: 40.
Source name:
World Development Indicators
Source organization:
International Monetary Fund, Government Finance Statistics Yearbook and data files.
Categories, topics:
Public Sector
Last updated:
apr 23, 2017
Indicators value changes by year
At the date of observation
Value
Absolute change
Change from previous value
jan 1, 1973
5.172
+5.172
0.0%
jan 1, 1974
4.57
-0.603
-11.65%
jan 1, 1975
4.179
-0.39
-8.55%
jan 1, 1976
3.403
-0.776
-18.56%
jan 1, 1977
3.322
-0.082
-2.4%
jan 1, 1978
2.872
-0.45
-13.55%
jan 1, 1979
2.635
-0.237
-8.24%
jan 1, 1980
2.915
+0.28
10.62%
jan 1, 1981
2.339
-0.576
-19.75%
jan 1, 1982
3.257
+0.918
39.24%
jan 1, 1983
2.114
-1.143
-35.1%
jan 1, 1984
1.93
-0.184
-8.7%
jan 1, 1985
2.516
+0.586
30.37%
jan 1, 1986
1.662
-0.855
-33.96%
jan 1, 1987
1.525
-0.137
-8.23%
jan 1, 1988
1.687
+0.162
10.65%
jan 1, 1989
1.874
+0.187
11.09%
jan 1, 1991
1.595
-0.279
-14.88%
jan 1, 1992
1.489
-0.107
-6.68%
jan 1, 1994
2.046
+0.558
37.45%
jan 1, 1995
2.943
+0.897
43.84%
jan 1, 1996
2.019
-0.925
-31.42%
jan 1, 1997
1.556
-0.462
-22.9%
jan 1, 1998
1.62
+0.063
4.08%
jan 1, 1999
1.476
-0.144
-8.9%
jan 1, 2000
1.236
-0.24
-16.25%
jan 1, 2001
1.073
-0.163
-13.18%
jan 1, 2002
1.408
+0.335
31.25%
jan 1, 2003
1.251
-0.157
-11.18%
jan 1, 2004
1.193
-0.057
-4.58%
jan 1, 2005
0.696
-0.497
-41.68%
jan 1, 2006
0.39
-0.306
-43.99%
jan 1, 2007
0.393
+0.003
0.72%
jan 1, 2008
0.653
+0.26
66.3%
jan 1, 2009
0.861
+0.208
31.81%
jan 1, 2010
0.887
+0.026
3.03%
jan 1, 2011
1.127
+0.24
27.07%
jan 1, 2012
0.919
-0.208
-18.48%
jan 1, 2013
0.776
-0.143
-15.55%
jan 1, 2014
0.65
-0.126
-16.28%
Ranking of countries by current statistics by years


Comments: