29
/
en
AIzaSyAYiBZKx7MnpbEhh9jyipgxe19OcubqV5w
April 1, 2024
73502
Australia
AUS
true
2
1
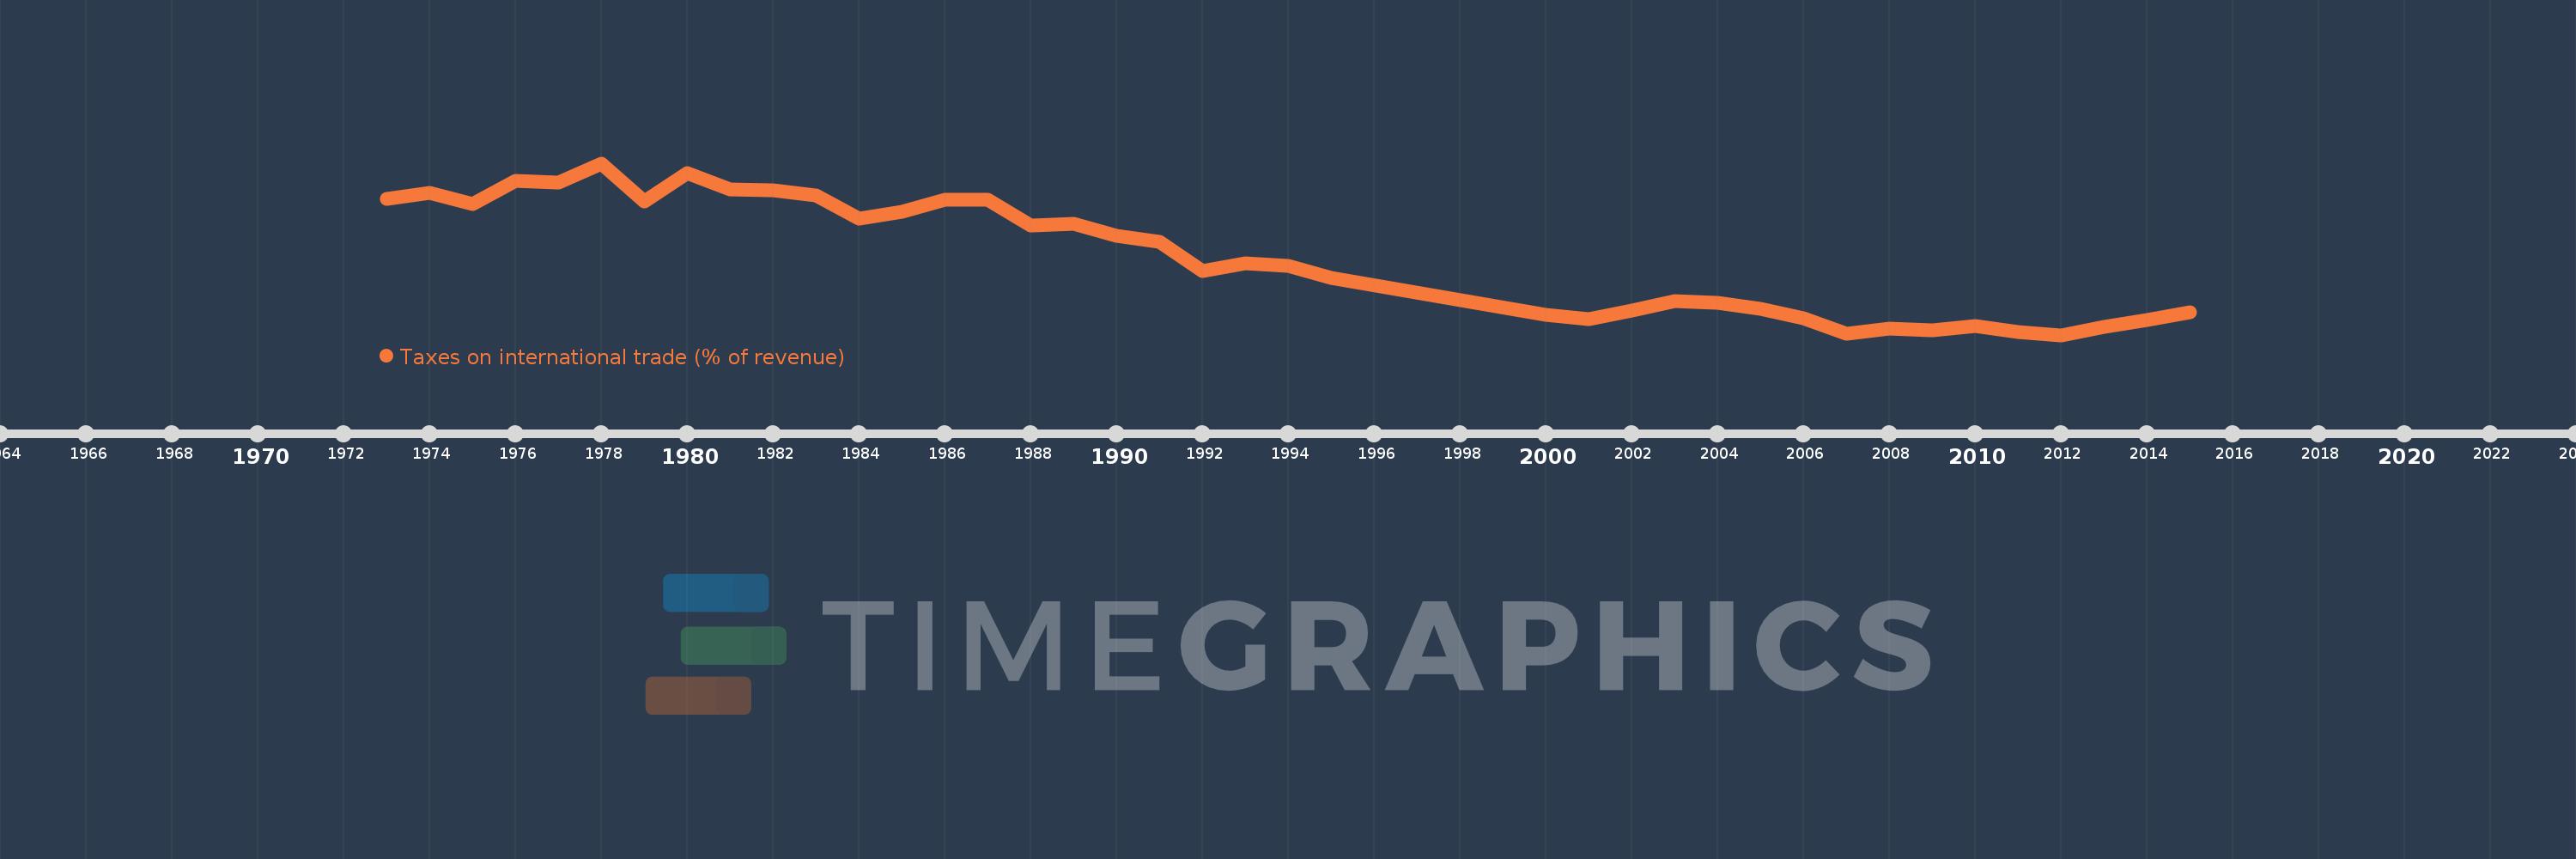
Taxes on international trade (% of revenue)
2015,2014,2013,2012,2011,2010,2009,2008,2007,2006,2005,2004,2003,2002,2001,2000,1995,1994,1993,1992,1991,1990,1989,1988,1987,1986,1985,1984,1983,1982,1981,1980,1979,1978,1977,1976,1975,1974,1973
This statistics in other country:
AfghanistanAlbaniaAlgeriaAngolaAntigua and BarbudaArab WorldArgentinaArmeniaAustraliaAustriaAzerbaijanBahamas, TheBahrainBangladeshBarbadosBelarusBelizeBeninBhutanBoliviaBosnia and HerzegovinaBotswanaBrazilBulgariaBurkina FasoBurundiCabo VerdeCambodiaCanadaCaribbean small statesCentral African RepublicCentral Europe and the BalticsChileChinaColombiaCongo, Dem. Rep.Congo, Rep.Costa RicaCote d'IvoireCroatiaCyprusCzech RepublicDenmarkDominicaDominican RepublicEarly-demographic dividendEast Asia & PacificEast Asia & Pacific (excluding high income)East Asia & Pacific (IDA & IBRD countries)Egypt, Arab Rep.El SalvadorEquatorial GuineaEstoniaEthiopiaEuro areaEurope & Central AsiaEurope & Central Asia (excluding high income)Europe & Central Asia (IDA & IBRD countries)European UnionFijiFinlandFranceGambia, TheGeorgiaGermanyGhanaGreeceGrenadaGuatemalaHeavily indebted poor countries (HIPC)High incomeHondurasHong Kong SAR, ChinaHungaryIBRD onlyIcelandIDA & IBRD totalIDA blendIDA onlyIDA totalIndiaIndonesiaIran, Islamic Rep.IraqIrelandIsraelItalyJamaicaJapanJordanKazakhstanKenyaKiribatiKorea, Rep.KuwaitKyrgyz RepublicLao PDRLate-demographic dividendLatin America & Caribbean Latin America & Caribbean (excluding high income)Latin America & the Caribbean (IDA & IBRD countries)LatviaLeast developed countries: UN classificationLebanonLesothoLiberiaLithuaniaLow & middle incomeLow incomeLower middle incomeLuxembourgMacedonia, FYRMadagascarMalawiMalaysiaMaldivesMaliMaltaMauritiusMexicoMicronesia, Fed. Sts.Middle East & North AfricaMiddle East & North Africa (excluding high income)Middle East & North Africa (IDA & IBRD countries)Middle incomeMoldovaMongoliaMoroccoMozambiqueMyanmarNamibiaNepalNetherlandsNew ZealandNicaraguaNorth AmericaNorwayOECD membersOmanOther small statesPakistanPanamaPapua New GuineaParaguayPeruPhilippinesPolandPortugalPost-demographic dividendPre-demographic dividendQatarRomaniaRussian FederationRwandaSamoaSan MarinoSao Tome and PrincipeSenegalSerbiaSeychellesSierra LeoneSingaporeSlovak RepublicSloveniaSmall statesSolomon IslandsSouth AfricaSouth AsiaSouth Asia (IDA & IBRD)SpainSri LankaSt. Kitts and NevisSt. LuciaSub-Saharan Africa Sub-Saharan Africa (excluding high income)Sub-Saharan Africa (IDA & IBRD countries)SurinameSwazilandSwedenSwitzerlandSyrian Arab RepublicTajikistanTanzaniaThailandTimor-LesteTogoTrinidad and TobagoTunisiaTurkeyUgandaUkraineUnited Arab EmiratesUnited KingdomUnited StatesUpper middle incomeUruguayVanuatuVenezuela, RBVietnamWest Bank and GazaWorldYemen, Rep.ZambiaZimbabwe Timeline:
This timeline shows a graph from 1973 to 2015 of Australia. No data until 1972. Number of actual observations by date: 39.
Source name:
World Development Indicators
Source organization:
International Monetary Fund, Government Finance Statistics Yearbook and data files.
Categories, topics:
Public Sector
Last updated:
apr 23, 2017
Indicators value changes by year
At the date of observation
Value
Absolute change
Change from previous value
jan 1, 1973
5.172
+5.172
0.0%
jan 1, 1974
5.314
+0.142
2.75%
jan 1, 1975
5.027
-0.287
-5.4%
jan 1, 1976
5.614
+0.587
11.67%
jan 1, 1977
5.569
-0.045
-0.8%
jan 1, 1978
6.038
+0.469
8.42%
jan 1, 1979
5.092
-0.946
-15.66%
jan 1, 1980
5.8
+0.708
13.89%
jan 1, 1981
5.393
-0.407
-7.02%
jan 1, 1982
5.372
-0.021
-0.38%
jan 1, 1983
5.244
-0.128
-2.38%
jan 1, 1984
4.68
-0.564
-10.75%
jan 1, 1985
4.846
+0.166
3.54%
jan 1, 1986
5.149
+0.303
6.26%
jan 1, 1987
5.135
-0.014
-0.28%
jan 1, 1988
4.498
-0.637
-12.4%
jan 1, 1989
4.54
+0.042
0.94%
jan 1, 1990
4.249
-0.291
-6.41%
jan 1, 1991
4.112
-0.137
-3.23%
jan 1, 1992
3.396
-0.716
-17.42%
jan 1, 1993
3.572
+0.176
5.19%
jan 1, 1994
3.507
-0.065
-1.81%
jan 1, 1995
3.224
-0.283
-8.08%
jan 1, 2000
2.315
-0.909
-28.21%
jan 1, 2001
2.213
-0.101
-4.38%
jan 1, 2002
2.412
+0.199
8.99%
jan 1, 2003
2.656
+0.244
10.12%
jan 1, 2004
2.606
-0.05
-1.87%
jan 1, 2005
2.45
-0.156
-6.0%
jan 1, 2006
2.223
-0.227
-9.26%
jan 1, 2007
1.856
-0.367
-16.51%
jan 1, 2008
1.968
+0.112
6.01%
jan 1, 2009
1.938
-0.03
-1.51%
jan 1, 2010
2.035
+0.097
5.02%
jan 1, 2011
1.897
-0.139
-6.81%
jan 1, 2012
1.814
-0.083
-4.38%
jan 1, 2013
2.014
+0.201
11.07%
jan 1, 2014
2.176
+0.162
8.02%
jan 1, 2015
2.378
+0.203
9.31%
Ranking of countries by current statistics by years


Comments: