29
/
en
AIzaSyAYiBZKx7MnpbEhh9jyipgxe19OcubqV5w
April 1, 2024
202356
Morocco
MAR
true
2
1
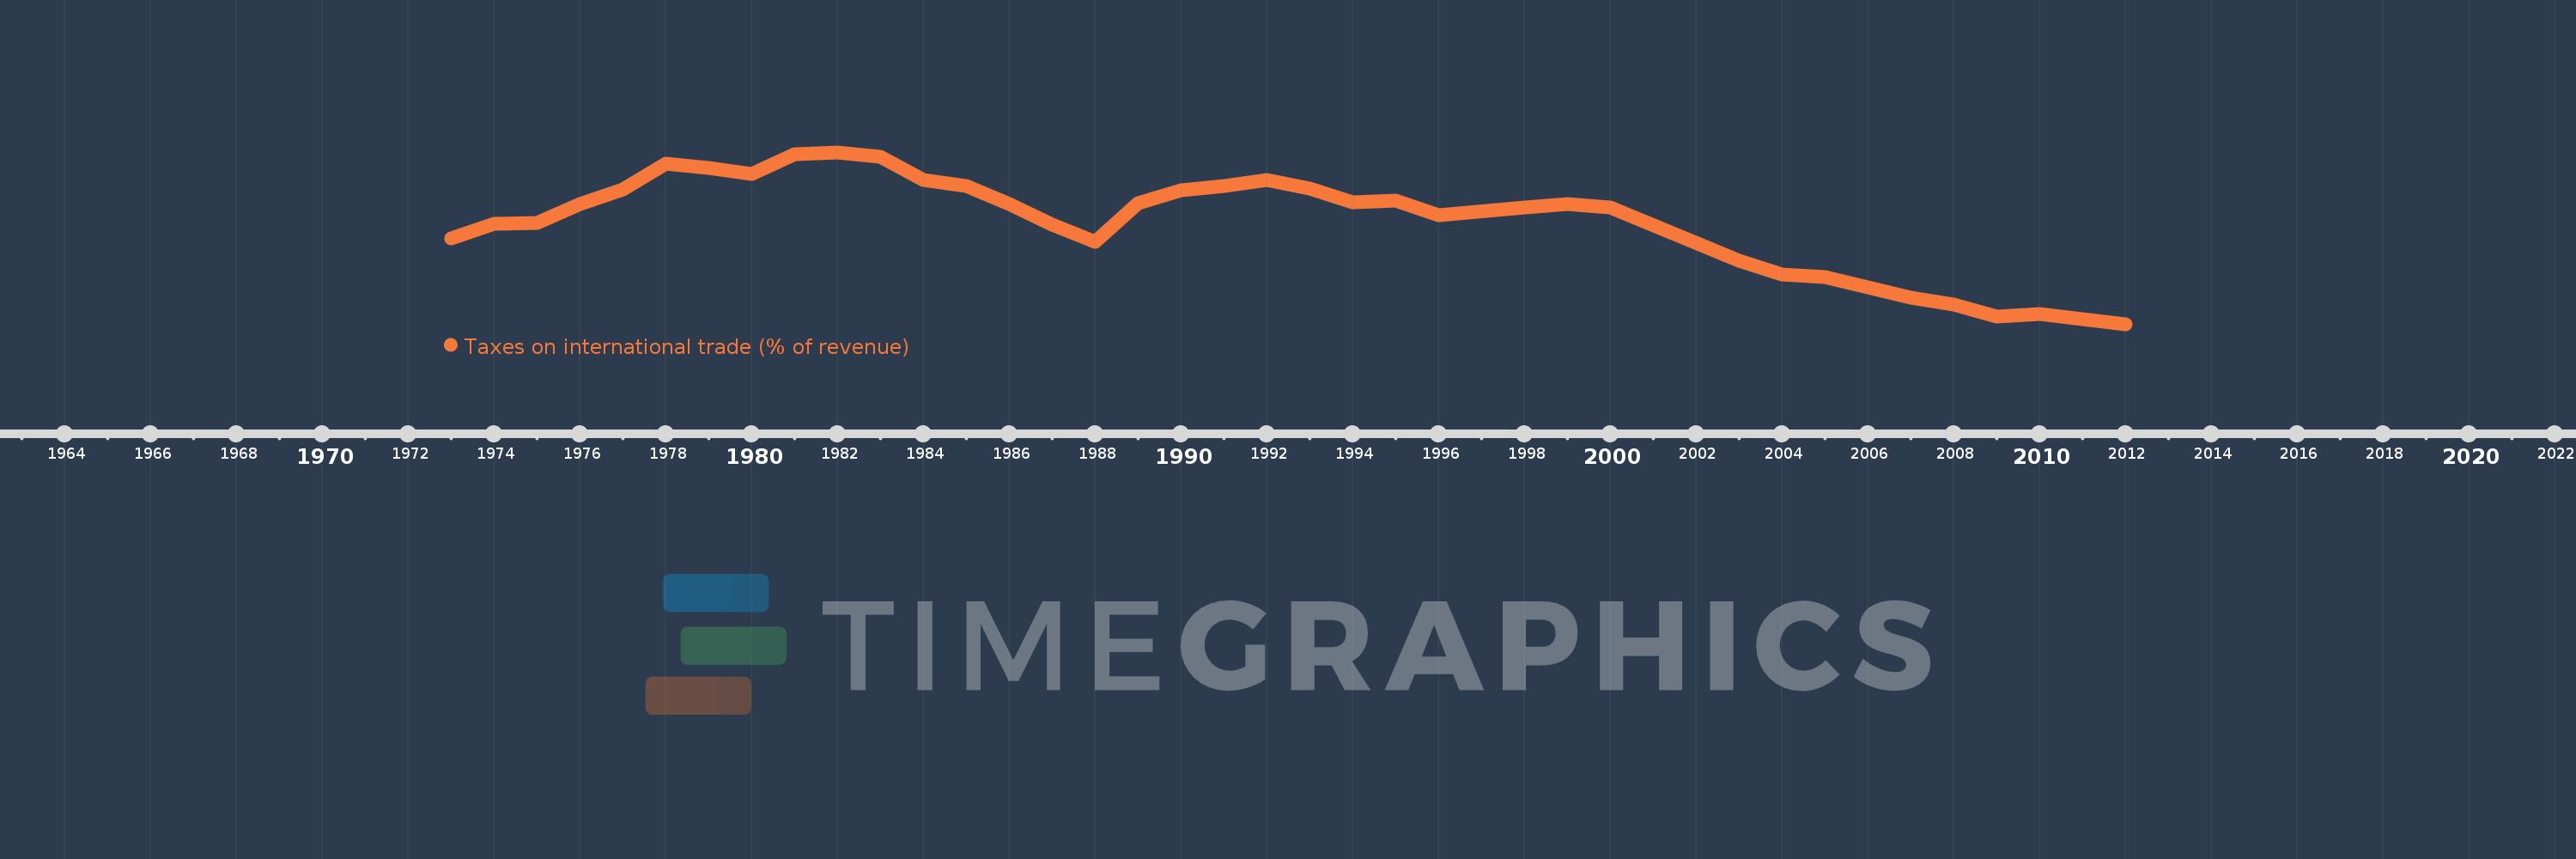
Taxes on international trade (% of revenue)
2012,2011,2010,2009,2008,2007,2006,2005,2004,2003,2000,1999,1998,1996,1995,1994,1993,1992,1991,1990,1989,1988,1987,1986,1985,1984,1983,1982,1981,1980,1979,1978,1977,1976,1975,1974,1973
This statistics in other country:
AfghanistanAlbaniaAlgeriaAngolaAntigua and BarbudaArab WorldArgentinaArmeniaAustraliaAustriaAzerbaijanBahamas, TheBahrainBangladeshBarbadosBelarusBelizeBeninBhutanBoliviaBosnia and HerzegovinaBotswanaBrazilBulgariaBurkina FasoBurundiCabo VerdeCambodiaCanadaCaribbean small statesCentral African RepublicCentral Europe and the BalticsChileChinaColombiaCongo, Dem. Rep.Congo, Rep.Costa RicaCote d'IvoireCroatiaCyprusCzech RepublicDenmarkDominicaDominican RepublicEarly-demographic dividendEast Asia & PacificEast Asia & Pacific (excluding high income)East Asia & Pacific (IDA & IBRD countries)Egypt, Arab Rep.El SalvadorEquatorial GuineaEstoniaEthiopiaEuro areaEurope & Central AsiaEurope & Central Asia (excluding high income)Europe & Central Asia (IDA & IBRD countries)European UnionFijiFinlandFranceGambia, TheGeorgiaGermanyGhanaGreeceGrenadaGuatemalaHeavily indebted poor countries (HIPC)High incomeHondurasHong Kong SAR, ChinaHungaryIBRD onlyIcelandIDA & IBRD totalIDA blendIDA onlyIDA totalIndiaIndonesiaIran, Islamic Rep.IraqIrelandIsraelItalyJamaicaJapanJordanKazakhstanKenyaKiribatiKorea, Rep.KuwaitKyrgyz RepublicLao PDRLate-demographic dividendLatin America & Caribbean Latin America & Caribbean (excluding high income)Latin America & the Caribbean (IDA & IBRD countries)LatviaLeast developed countries: UN classificationLebanonLesothoLiberiaLithuaniaLow & middle incomeLow incomeLower middle incomeLuxembourgMacedonia, FYRMadagascarMalawiMalaysiaMaldivesMaliMaltaMauritiusMexicoMicronesia, Fed. Sts.Middle East & North AfricaMiddle East & North Africa (excluding high income)Middle East & North Africa (IDA & IBRD countries)Middle incomeMoldovaMongoliaMoroccoMozambiqueMyanmarNamibiaNepalNetherlandsNew ZealandNicaraguaNorth AmericaNorwayOECD membersOmanOther small statesPakistanPanamaPapua New GuineaParaguayPeruPhilippinesPolandPortugalPost-demographic dividendPre-demographic dividendQatarRomaniaRussian FederationRwandaSamoaSan MarinoSao Tome and PrincipeSenegalSerbiaSeychellesSierra LeoneSingaporeSlovak RepublicSloveniaSmall statesSolomon IslandsSouth AfricaSouth AsiaSouth Asia (IDA & IBRD)SpainSri LankaSt. Kitts and NevisSt. LuciaSub-Saharan Africa Sub-Saharan Africa (excluding high income)Sub-Saharan Africa (IDA & IBRD countries)SurinameSwazilandSwedenSwitzerlandSyrian Arab RepublicTajikistanTanzaniaThailandTimor-LesteTogoTrinidad and TobagoTunisiaTurkeyUgandaUkraineUnited Arab EmiratesUnited KingdomUnited StatesUpper middle incomeUruguayVanuatuVenezuela, RBVietnamWest Bank and GazaWorldYemen, Rep.ZambiaZimbabwe Timeline:
This timeline shows a graph from 1973 to 2012 of Morocco. No data until 1972. Number of actual observations by date: 37.
Source name:
World Development Indicators
Source organization:
International Monetary Fund, Government Finance Statistics Yearbook and data files.
Categories, topics:
Public Sector
Last updated:
apr 23, 2017
Indicators value changes by year
Maximum:
20.971
jan 1, 1982
At the date of observation
Value
Absolute change
Change from previous value
jan 1, 1973
13.002
+13.002
0.0%
jan 1, 1974
14.347
+1.344
10.34%
jan 1, 1975
14.428
+0.081
0.56%
jan 1, 1976
16.174
+1.746
12.1%
jan 1, 1977
17.508
+1.334
8.25%
jan 1, 1978
19.944
+2.436
13.91%
jan 1, 1979
19.495
-0.45
-2.25%
jan 1, 1980
18.937
-0.558
-2.86%
jan 1, 1981
20.783
+1.846
9.75%
jan 1, 1982
20.971
+0.188
0.9%
jan 1, 1983
20.527
-0.443
-2.11%
jan 1, 1984
18.382
-2.146
-10.45%
jan 1, 1985
17.868
-0.514
-2.8%
jan 1, 1986
16.186
-1.681
-9.41%
jan 1, 1987
14.256
-1.93
-11.92%
jan 1, 1988
12.723
-1.533
-10.76%
jan 1, 1989
16.276
+3.553
27.93%
jan 1, 1990
17.441
+1.165
7.16%
jan 1, 1991
17.836
+0.395
2.26%
jan 1, 1992
18.421
+0.585
3.28%
jan 1, 1993
17.63
-0.792
-4.3%
jan 1, 1994
16.39
-1.24
-7.03%
jan 1, 1995
16.478
+0.089
0.54%
jan 1, 1996
15.184
-1.294
-7.86%
jan 1, 1998
15.86
+0.676
4.46%
jan 1, 1999
16.176
+0.316
1.99%
jan 1, 2000
15.906
-0.271
-1.67%
jan 1, 2003
10.923
-4.982
-31.32%
jan 1, 2004
9.704
-1.219
-11.16%
jan 1, 2005
9.461
-0.243
-2.51%
jan 1, 2006
8.439
-1.021
-10.8%
jan 1, 2007
7.527
-0.913
-10.81%
jan 1, 2008
6.886
-0.641
-8.51%
jan 1, 2009
5.805
-1.081
-15.7%
jan 1, 2010
5.994
+0.19
3.27%
jan 1, 2011
5.551
-0.443
-7.4%
jan 1, 2012
5.065
-0.486
-8.76%
Ranking of countries by current statistics by years


Comments: