29
/
en
AIzaSyAYiBZKx7MnpbEhh9jyipgxe19OcubqV5w
April 1, 2024
55197
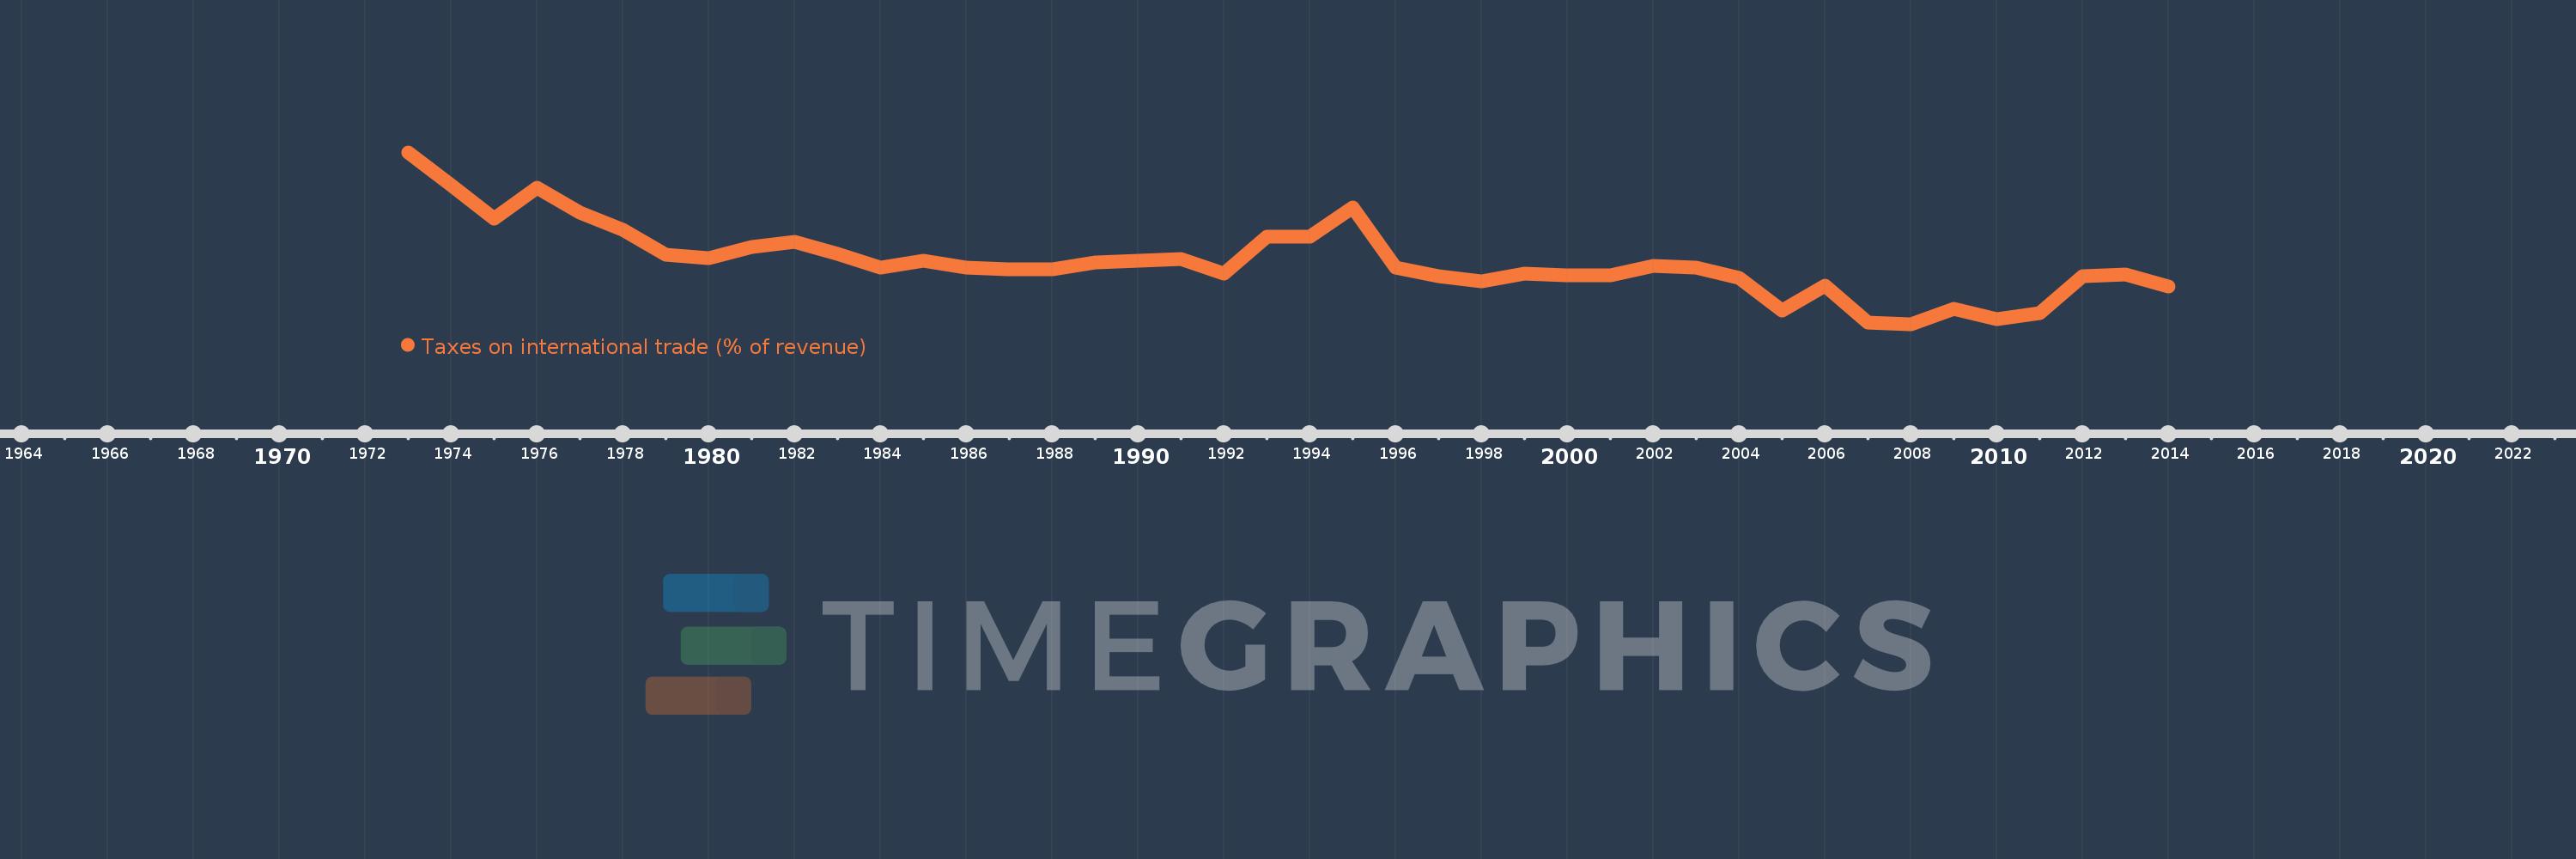
Post-demographic dividend
PST
false
2
1
Taxes on international trade (% of revenue)
2014,2013,2012,2011,2010,2009,2008,2007,2006,2005,2004,2003,2002,2001,2000,1999,1998,1997,1996,1995,1994,1993,1992,1991,1989,1988,1987,1986,1985,1984,1983,1982,1981,1980,1979,1978,1977,1976,1975,1974,1973
This statistics in other country:
AfghanistanAlbaniaAlgeriaAngolaAntigua and BarbudaArab WorldArgentinaArmeniaAustraliaAustriaAzerbaijanBahamas, TheBahrainBangladeshBarbadosBelarusBelizeBeninBhutanBoliviaBosnia and HerzegovinaBotswanaBrazilBulgariaBurkina FasoBurundiCabo VerdeCambodiaCanadaCaribbean small statesCentral African RepublicCentral Europe and the BalticsChileChinaColombiaCongo, Dem. Rep.Congo, Rep.Costa RicaCote d'IvoireCroatiaCyprusCzech RepublicDenmarkDominicaDominican RepublicEarly-demographic dividendEast Asia & PacificEast Asia & Pacific (excluding high income)East Asia & Pacific (IDA & IBRD countries)Egypt, Arab Rep.El SalvadorEquatorial GuineaEstoniaEthiopiaEuro areaEurope & Central AsiaEurope & Central Asia (excluding high income)Europe & Central Asia (IDA & IBRD countries)European UnionFijiFinlandFranceGambia, TheGeorgiaGermanyGhanaGreeceGrenadaGuatemalaHeavily indebted poor countries (HIPC)High incomeHondurasHong Kong SAR, ChinaHungaryIBRD onlyIcelandIDA & IBRD totalIDA blendIDA onlyIDA totalIndiaIndonesiaIran, Islamic Rep.IraqIrelandIsraelItalyJamaicaJapanJordanKazakhstanKenyaKiribatiKorea, Rep.KuwaitKyrgyz RepublicLao PDRLate-demographic dividendLatin America & Caribbean Latin America & Caribbean (excluding high income)Latin America & the Caribbean (IDA & IBRD countries)LatviaLeast developed countries: UN classificationLebanonLesothoLiberiaLithuaniaLow & middle incomeLow incomeLower middle incomeLuxembourgMacedonia, FYRMadagascarMalawiMalaysiaMaldivesMaliMaltaMauritiusMexicoMicronesia, Fed. Sts.Middle East & North AfricaMiddle East & North Africa (excluding high income)Middle East & North Africa (IDA & IBRD countries)Middle incomeMoldovaMongoliaMoroccoMozambiqueMyanmarNamibiaNepalNetherlandsNew ZealandNicaraguaNorth AmericaNorwayOECD membersOmanOther small statesPakistanPanamaPapua New GuineaParaguayPeruPhilippinesPolandPortugalPost-demographic dividendPre-demographic dividendQatarRomaniaRussian FederationRwandaSamoaSan MarinoSao Tome and PrincipeSenegalSerbiaSeychellesSierra LeoneSingaporeSlovak RepublicSloveniaSmall statesSolomon IslandsSouth AfricaSouth AsiaSouth Asia (IDA & IBRD)SpainSri LankaSt. Kitts and NevisSt. LuciaSub-Saharan Africa Sub-Saharan Africa (excluding high income)Sub-Saharan Africa (IDA & IBRD countries)SurinameSwazilandSwedenSwitzerlandSyrian Arab RepublicTajikistanTanzaniaThailandTimor-LesteTogoTrinidad and TobagoTunisiaTurkeyUgandaUkraineUnited Arab EmiratesUnited KingdomUnited StatesUpper middle incomeUruguayVanuatuVenezuela, RBVietnamWest Bank and GazaWorldYemen, Rep.ZambiaZimbabwe Timeline:
This timeline shows a graph from 1973 to 2014 of Post-demographic dividend. No data until 1972. Number of actual observations by date: 41.
Source name:
World Development Indicators
Source organization:
International Monetary Fund, Government Finance Statistics Yearbook and data files.
Categories, topics:
Public Sector
Last updated:
apr 23, 2017
Indicators value changes by year
At the date of observation
Value
Absolute change
Change from previous value
jan 1, 1973
3.478
+3.478
0.0%
jan 1, 1974
2.875
-0.602
-17.32%
jan 1, 1975
2.27
-0.606
-21.06%
jan 1, 1976
2.839
+0.569
25.09%
jan 1, 1977
2.373
-0.467
-16.43%
jan 1, 1978
2.073
-0.3
-12.63%
jan 1, 1979
1.613
-0.459
-22.16%
jan 1, 1980
1.551
-0.062
-3.85%
jan 1, 1981
1.755
+0.204
13.15%
jan 1, 1982
1.847
+0.091
5.2%
jan 1, 1983
1.623
-0.224
-12.14%
jan 1, 1984
1.376
-0.247
-15.22%
jan 1, 1985
1.501
+0.125
9.12%
jan 1, 1986
1.378
-0.123
-8.22%
jan 1, 1987
1.344
-0.033
-2.43%
jan 1, 1988
1.347
+0.003
0.22%
jan 1, 1989
1.479
+0.132
9.77%
jan 1, 1991
1.529
+0.05
3.37%
jan 1, 1992
1.275
-0.254
-16.59%
jan 1, 1993
1.935
+0.659
51.72%
jan 1, 1994
1.937
+0.003
0.15%
jan 1, 1995
2.478
+0.541
27.9%
jan 1, 1996
1.381
-1.097
-44.28%
jan 1, 1997
1.22
-0.161
-11.64%
jan 1, 1998
1.123
-0.097
-7.92%
jan 1, 1999
1.27
+0.147
13.05%
jan 1, 2000
1.231
-0.039
-3.05%
jan 1, 2001
1.241
+0.01
0.79%
jan 1, 2002
1.408
+0.167
13.49%
jan 1, 2003
1.374
-0.035
-2.45%
jan 1, 2004
1.193
-0.18
-13.12%
jan 1, 2005
0.599
-0.594
-49.77%
jan 1, 2006
1.043
+0.444
74.02%
jan 1, 2007
0.38
-0.663
-63.55%
jan 1, 2008
0.347
-0.033
-8.65%
jan 1, 2009
0.633
+0.285
82.19%
jan 1, 2010
0.445
-0.188
-29.65%
jan 1, 2011
0.544
+0.098
22.1%
jan 1, 2012
1.227
+0.684
125.79%
jan 1, 2013
1.257
+0.03
2.42%
jan 1, 2014
1.035
-0.222
-17.68%
Ranking of countries by current statistics by years


Comments: