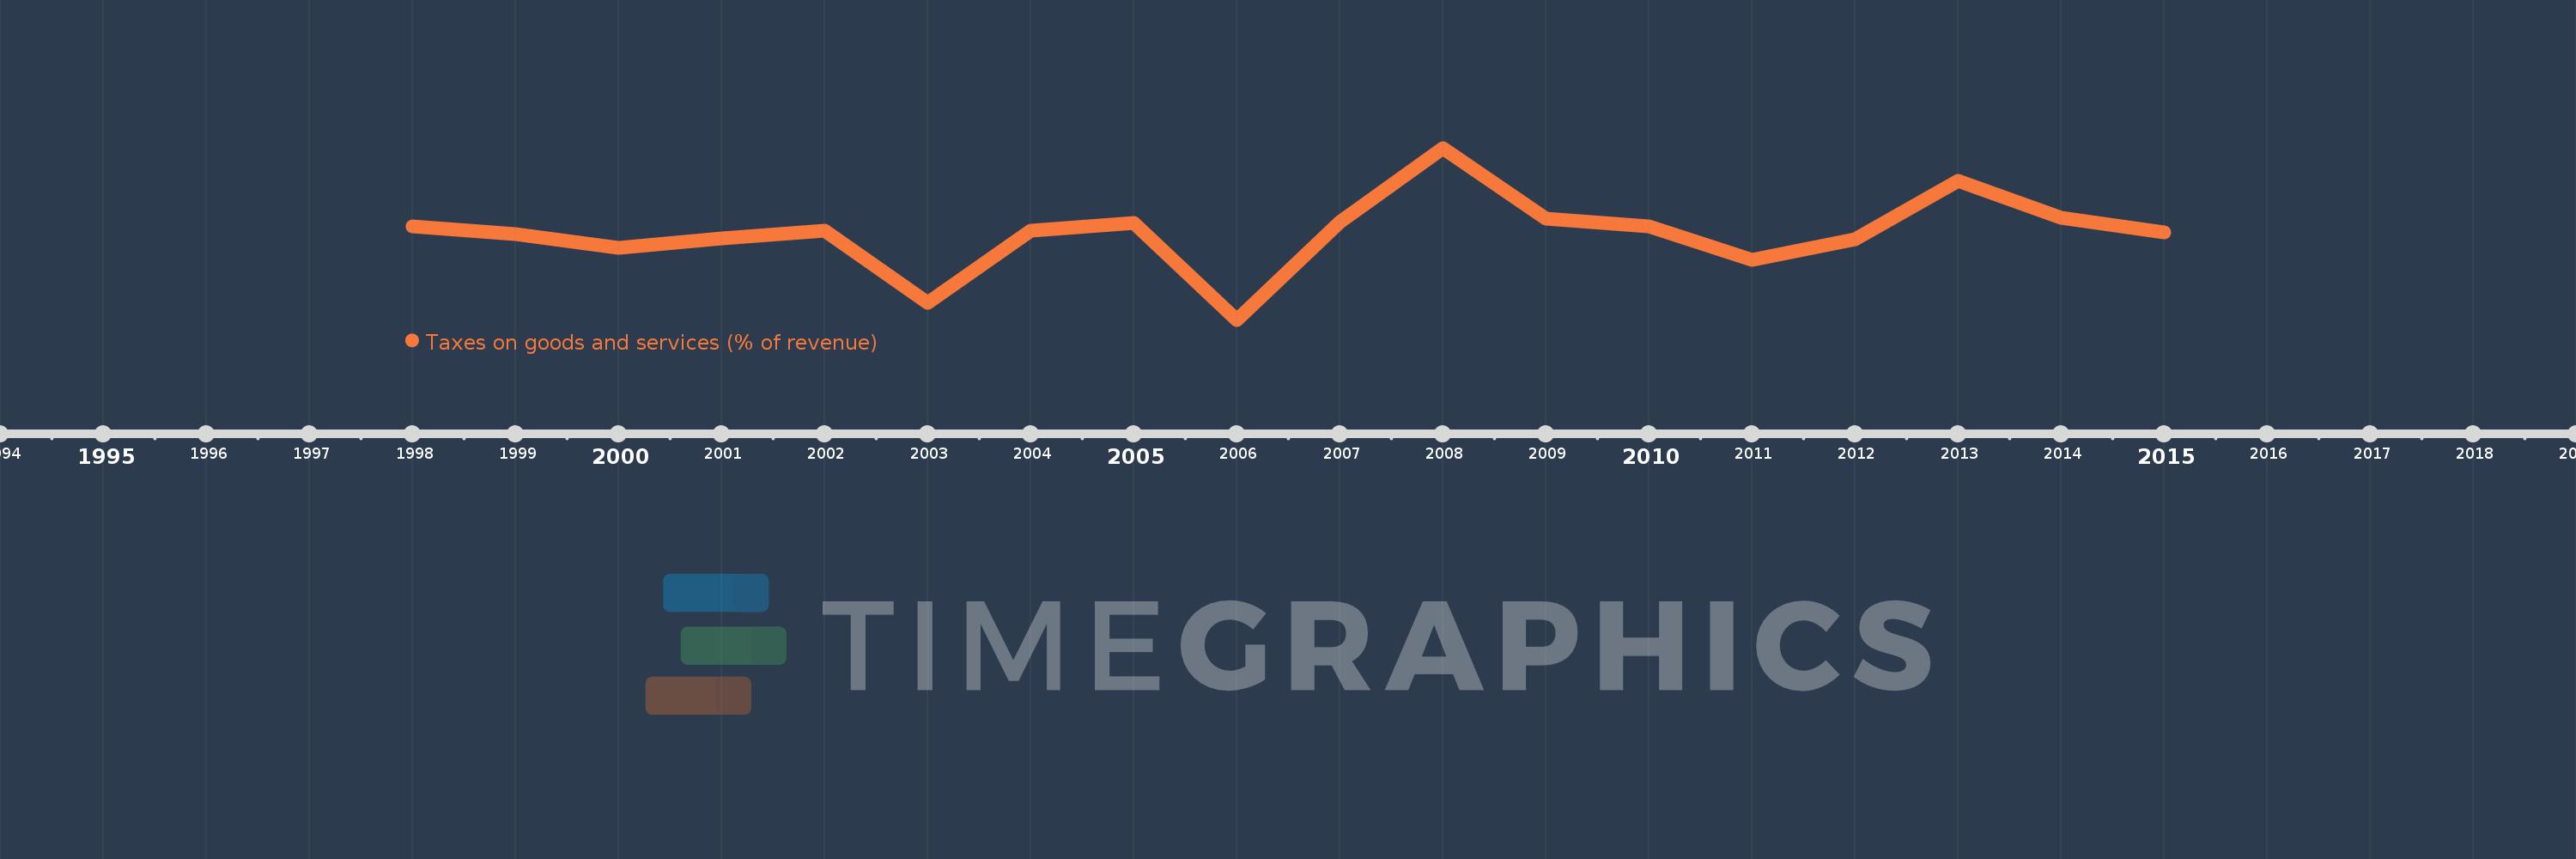
This timeline shows a graph from 1998 to 2015 of Europe & Central Asia (IDA & IBRD countries). No data until 1997. Number of actual observations by date: 18.
Source name:
World Development Indicators
Source organization:
International Monetary Fund, Government Finance Statistics Yearbook and data files.
Categories, topics:
Public Sector
Last updated:
apr 23, 2017
Indicators value changes by year
Meaning:
39.625
Minimum:
36.873
jan 1, 2006
Maximum:
42.343
jan 1, 2008
At the date of observation
Value
Absolute change
Change from the previous value
jan 1, 1998
39.853
+39.853
0.0%
jan 1, 1999
39.596
-0.257
-0.64%
jan 1, 2000
39.163
-0.433
-1.09%
jan 1, 2001
39.453
+0.29
0.74%
jan 1, 2002
39.707
+0.254
0.64%
jan 1, 2003
37.412
-2.296
-5.78%
jan 1, 2004
39.697
+2.285
6.11%
jan 1, 2005
39.945
+0.248
0.62%
jan 1, 2006
36.873
-3.072
-7.69%
jan 1, 2007
39.988
+3.115
8.45%
jan 1, 2008
42.343
+2.355
5.89%
jan 1, 2009
40.092
-2.251
-5.32%
jan 1, 2010
39.841
-0.251
-0.63%
jan 1, 2011
38.767
-1.074
-2.7%
jan 1, 2012
39.424
+0.657
1.69%
jan 1, 2013
41.304
+1.881
4.77%
jan 1, 2014
40.13
-1.175
-2.84%
jan 1, 2015
39.657
-0.472
-1.18%
Ranking of countries by current statistics by years
