29
/
en
AIzaSyAYiBZKx7MnpbEhh9jyipgxe19OcubqV5w
April 1, 2024
113040
Costa Rica
CRI
true
2
1
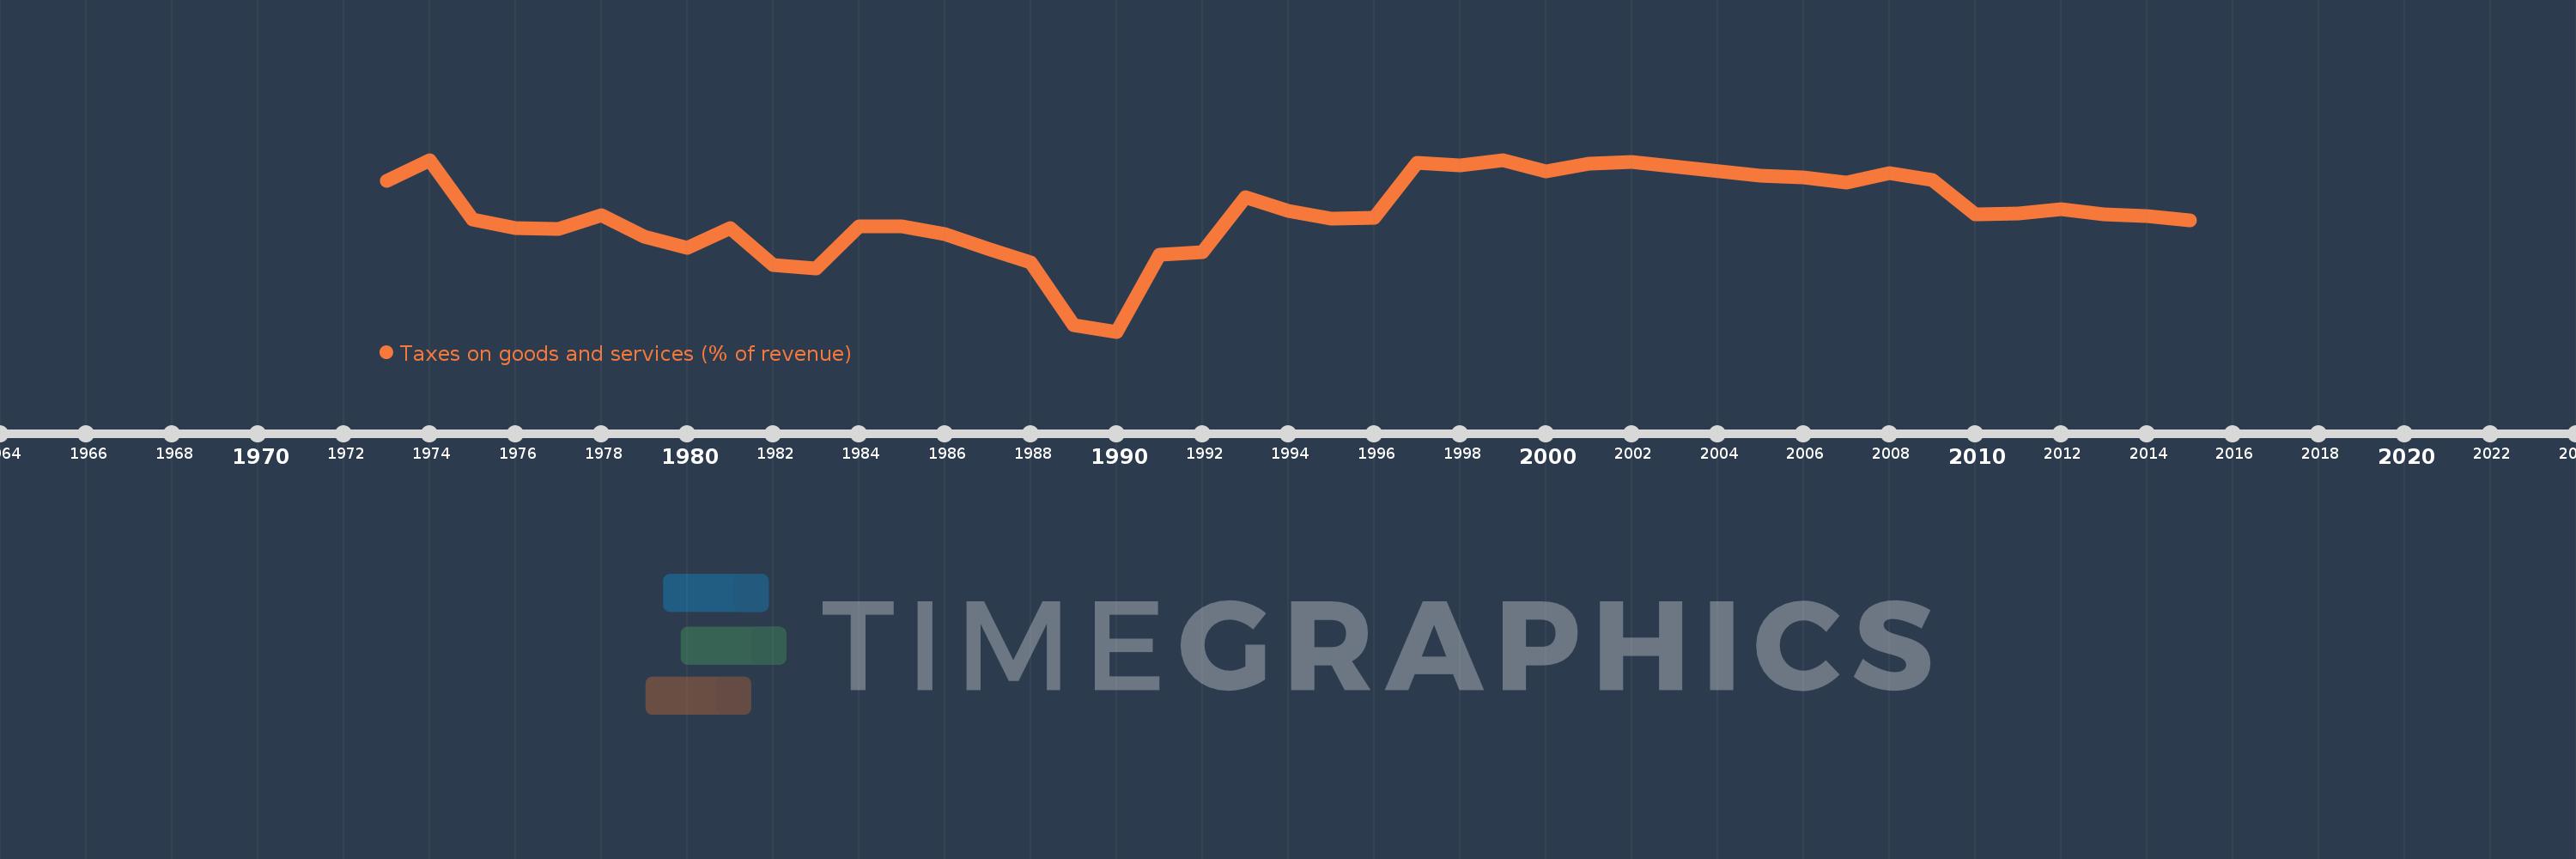
Taxes on goods and services (% of revenue)
2015,2014,2013,2012,2011,2010,2009,2008,2007,2006,2005,2002,2001,2000,1999,1998,1997,1996,1995,1994,1993,1992,1991,1990,1989,1988,1987,1986,1985,1984,1983,1982,1981,1980,1979,1978,1977,1976,1975,1974,1973
This statistics in other country:
AfghanistanAlbaniaAlgeriaAngolaAntigua and BarbudaArab WorldArgentinaArmeniaAustraliaAustriaAzerbaijanBahamas, TheBahrainBangladeshBarbadosBelarusBelgiumBelizeBeninBhutanBoliviaBosnia and HerzegovinaBotswanaBrazilBulgariaBurkina FasoBurundiCabo VerdeCambodiaCanadaCaribbean small statesCentral African RepublicCentral Europe and the BalticsChileChinaColombiaCongo, Dem. Rep.Congo, Rep.Costa RicaCote d'IvoireCroatiaCyprusCzech RepublicDenmarkDominicaDominican RepublicEarly-demographic dividendEast Asia & PacificEast Asia & Pacific (excluding high income)East Asia & Pacific (IDA & IBRD countries)Egypt, Arab Rep.El SalvadorEquatorial GuineaEstoniaEthiopiaEuro areaEurope & Central AsiaEurope & Central Asia (excluding high income)Europe & Central Asia (IDA & IBRD countries)European UnionFijiFinlandFranceGambia, TheGeorgiaGermanyGhanaGreeceGrenadaGuatemalaHeavily indebted poor countries (HIPC)High incomeHondurasHong Kong SAR, ChinaHungaryIBRD onlyIcelandIDA & IBRD totalIDA blendIDA onlyIDA totalIndiaIndonesiaIran, Islamic Rep.IraqIrelandIsraelItalyJamaicaJapanJordanKazakhstanKenyaKiribatiKorea, Rep.KuwaitKyrgyz RepublicLao PDRLate-demographic dividendLatin America & Caribbean Latin America & Caribbean (excluding high income)Latin America & the Caribbean (IDA & IBRD countries)LatviaLeast developed countries: UN classificationLebanonLesothoLiberiaLithuaniaLow & middle incomeLow incomeLower middle incomeLuxembourgMacao SAR, ChinaMacedonia, FYRMadagascarMalawiMalaysiaMaldivesMaliMaltaMauritiusMexicoMicronesia, Fed. Sts.Middle East & North AfricaMiddle East & North Africa (excluding high income)Middle East & North Africa (IDA & IBRD countries)Middle incomeMoldovaMongoliaMoroccoMozambiqueMyanmarNamibiaNepalNetherlandsNew ZealandNicaraguaNigeriaNorth AmericaNorwayOECD membersOmanOther small statesPakistanPanamaPapua New GuineaParaguayPeruPhilippinesPolandPortugalPost-demographic dividendPre-demographic dividendRomaniaRussian FederationRwandaSamoaSan MarinoSao Tome and PrincipeSenegalSerbiaSeychellesSierra LeoneSingaporeSlovak RepublicSloveniaSmall statesSolomon IslandsSouth AfricaSouth AsiaSouth Asia (IDA & IBRD)SpainSri LankaSt. Kitts and NevisSt. LuciaSub-Saharan Africa Sub-Saharan Africa (excluding high income)Sub-Saharan Africa (IDA & IBRD countries)SurinameSwazilandSwedenSwitzerlandSyrian Arab RepublicTajikistanTanzaniaThailandTimor-LesteTogoTrinidad and TobagoTunisiaTurkeyUgandaUkraineUnited Arab EmiratesUnited KingdomUnited StatesUpper middle incomeUruguayVanuatuVenezuela, RBVietnamWest Bank and GazaWorldYemen, Rep.ZambiaZimbabwe Timeline:
This timeline shows a graph from 1973 to 2015 of Costa Rica. No data until 1972. Number of actual observations by date: 41.
Source name:
World Development Indicators
Source organization:
International Monetary Fund, Government Finance Statistics Yearbook and data files.
Categories, topics:
Public Sector
Last updated:
apr 23, 2017
Indicators value changes by year
Minimum:
17.336
jan 1, 1990
Maximum:
40.123
jan 1, 1974
At the date of observation
Value
Absolute change
Change from previous value
jan 1, 1973
37.302
+37.302
0.0%
jan 1, 1974
40.123
+2.822
7.57%
jan 1, 1975
32.245
-7.879
-19.64%
jan 1, 1976
31.023
-1.222
-3.79%
jan 1, 1977
30.959
-0.064
-0.21%
jan 1, 1978
32.802
+1.843
5.95%
jan 1, 1979
29.913
-2.889
-8.81%
jan 1, 1980
28.481
-1.432
-4.79%
jan 1, 1981
31.03
+2.549
8.95%
jan 1, 1982
26.202
-4.828
-15.56%
jan 1, 1983
25.719
-0.483
-1.84%
jan 1, 1984
31.306
+5.586
21.72%
jan 1, 1985
31.336
+0.03
0.1%
jan 1, 1986
30.285
-1.051
-3.35%
jan 1, 1987
28.336
-1.95
-6.44%
jan 1, 1988
26.541
-1.795
-6.33%
jan 1, 1989
18.206
-8.335
-31.41%
jan 1, 1990
17.336
-0.87
-4.78%
jan 1, 1991
27.556
+10.22
58.95%
jan 1, 1992
27.861
+0.305
1.11%
jan 1, 1993
35.206
+7.344
26.36%
jan 1, 1994
33.315
-1.89
-5.37%
jan 1, 1995
32.276
-1.04
-3.12%
jan 1, 1996
32.45
+0.174
0.54%
jan 1, 1997
39.779
+7.329
22.59%
jan 1, 1998
39.393
-0.386
-0.97%
jan 1, 1999
40.096
+0.704
1.79%
jan 1, 2000
38.623
-1.474
-3.68%
jan 1, 2001
39.621
+0.998
2.59%
jan 1, 2002
39.863
+0.242
0.61%
jan 1, 2005
38.046
-1.817
-4.56%
jan 1, 2006
37.816
-0.23
-0.6%
jan 1, 2007
37.151
-0.664
-1.76%
jan 1, 2008
38.353
+1.202
3.24%
jan 1, 2009
37.449
-0.904
-2.36%
jan 1, 2010
32.834
-4.615
-12.32%
jan 1, 2011
33.042
+0.208
0.63%
jan 1, 2012
33.573
+0.531
1.61%
jan 1, 2013
32.846
-0.727
-2.17%
jan 1, 2014
32.653
-0.193
-0.59%
jan 1, 2015
32.13
-0.523
-1.6%
Ranking of countries by current statistics by years


Comments: