29
/
en
AIzaSyAYiBZKx7MnpbEhh9jyipgxe19OcubqV5w
April 1, 2024
139819
Germany
DEU
true
2
1
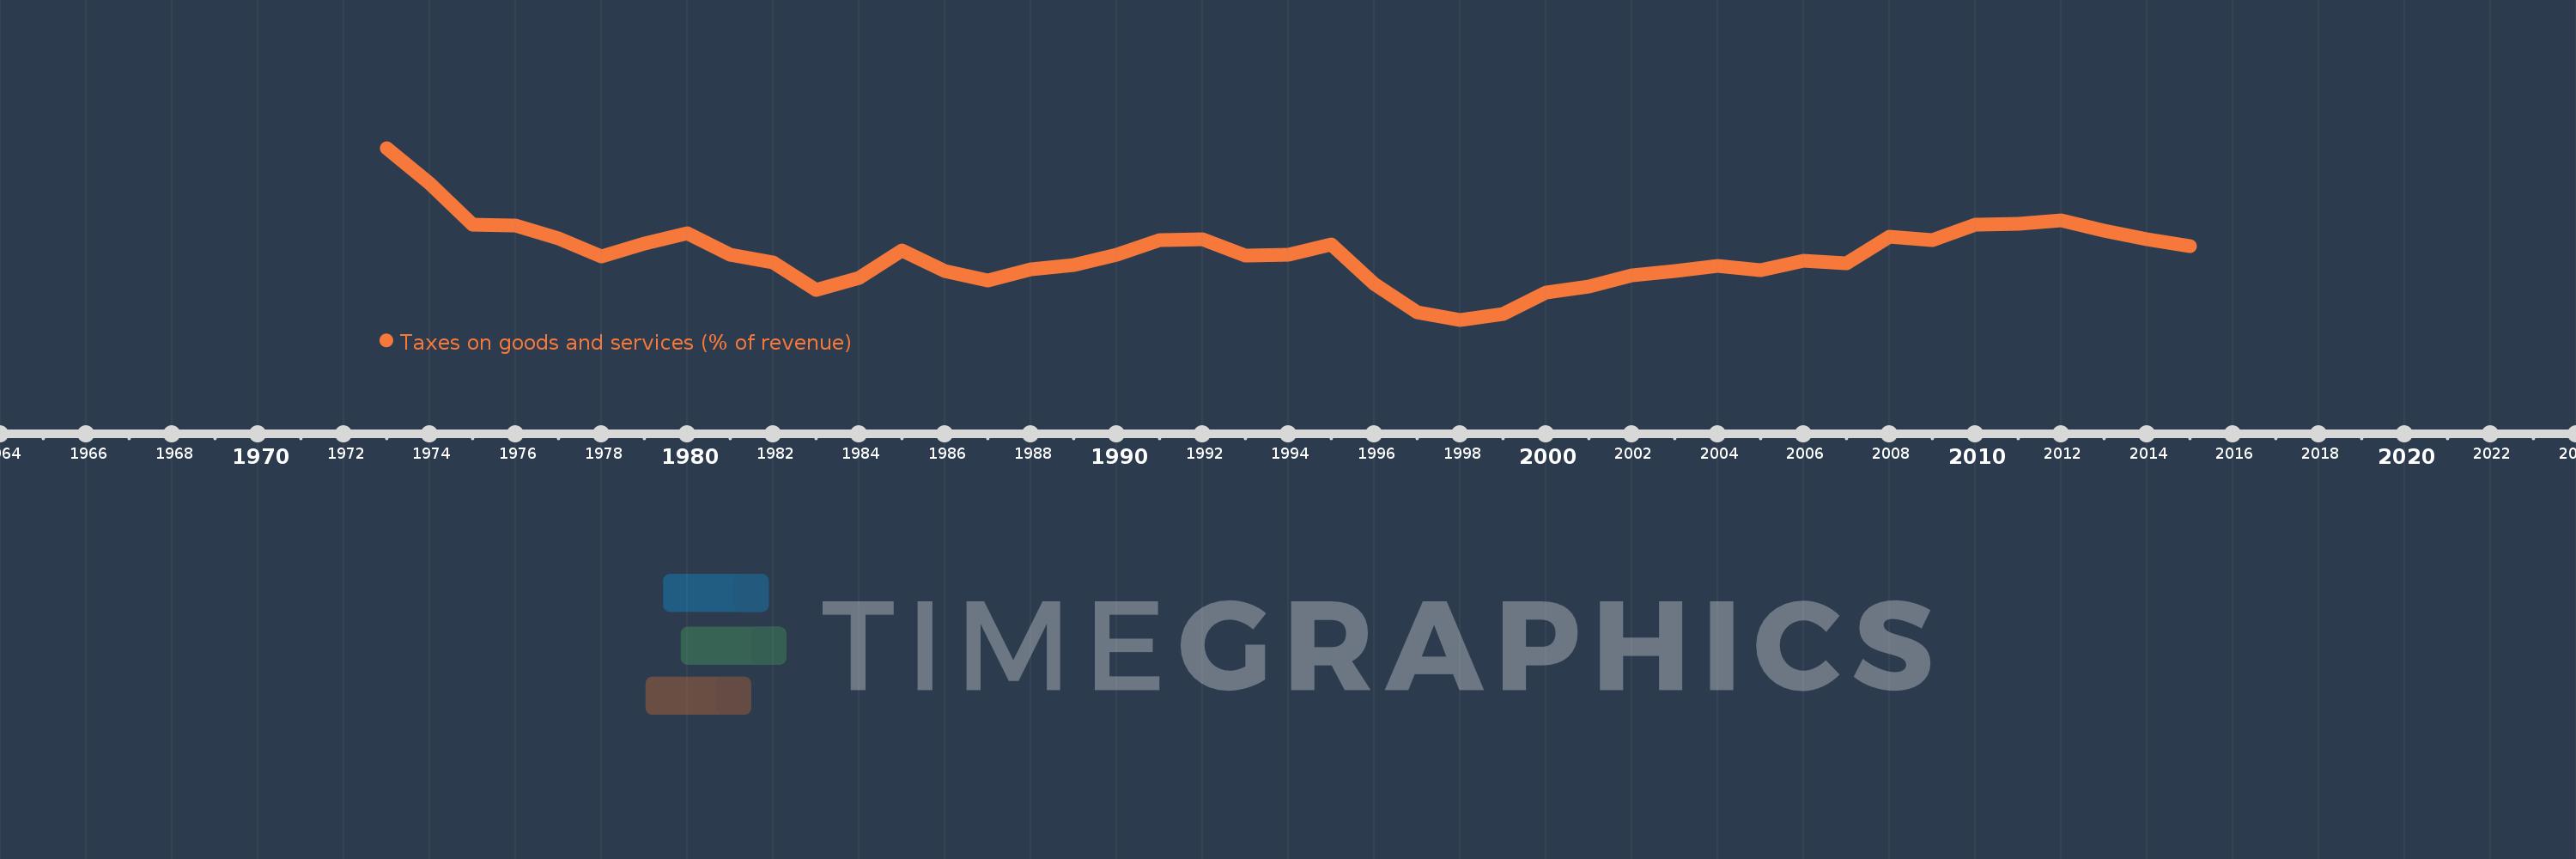
Taxes on goods and services (% of revenue)
2015,2014,2013,2012,2011,2010,2009,2008,2007,2006,2005,2004,2003,2002,2001,2000,1999,1998,1997,1996,1995,1994,1993,1992,1991,1990,1989,1988,1987,1986,1985,1984,1983,1982,1981,1980,1979,1978,1977,1976,1975,1974,1973
This statistics in other country:
AfghanistanAlbaniaAlgeriaAngolaAntigua and BarbudaArab WorldArgentinaArmeniaAustraliaAustriaAzerbaijanBahamas, TheBahrainBangladeshBarbadosBelarusBelgiumBelizeBeninBhutanBoliviaBosnia and HerzegovinaBotswanaBrazilBulgariaBurkina FasoBurundiCabo VerdeCambodiaCanadaCaribbean small statesCentral African RepublicCentral Europe and the BalticsChileChinaColombiaCongo, Dem. Rep.Congo, Rep.Costa RicaCote d'IvoireCroatiaCyprusCzech RepublicDenmarkDominicaDominican RepublicEarly-demographic dividendEast Asia & PacificEast Asia & Pacific (excluding high income)East Asia & Pacific (IDA & IBRD countries)Egypt, Arab Rep.El SalvadorEquatorial GuineaEstoniaEthiopiaEuro areaEurope & Central AsiaEurope & Central Asia (excluding high income)Europe & Central Asia (IDA & IBRD countries)European UnionFijiFinlandFranceGambia, TheGeorgiaGermanyGhanaGreeceGrenadaGuatemalaHeavily indebted poor countries (HIPC)High incomeHondurasHong Kong SAR, ChinaHungaryIBRD onlyIcelandIDA & IBRD totalIDA blendIDA onlyIDA totalIndiaIndonesiaIran, Islamic Rep.IraqIrelandIsraelItalyJamaicaJapanJordanKazakhstanKenyaKiribatiKorea, Rep.KuwaitKyrgyz RepublicLao PDRLate-demographic dividendLatin America & Caribbean Latin America & Caribbean (excluding high income)Latin America & the Caribbean (IDA & IBRD countries)LatviaLeast developed countries: UN classificationLebanonLesothoLiberiaLithuaniaLow & middle incomeLow incomeLower middle incomeLuxembourgMacao SAR, ChinaMacedonia, FYRMadagascarMalawiMalaysiaMaldivesMaliMaltaMauritiusMexicoMicronesia, Fed. Sts.Middle East & North AfricaMiddle East & North Africa (excluding high income)Middle East & North Africa (IDA & IBRD countries)Middle incomeMoldovaMongoliaMoroccoMozambiqueMyanmarNamibiaNepalNetherlandsNew ZealandNicaraguaNigeriaNorth AmericaNorwayOECD membersOmanOther small statesPakistanPanamaPapua New GuineaParaguayPeruPhilippinesPolandPortugalPost-demographic dividendPre-demographic dividendRomaniaRussian FederationRwandaSamoaSan MarinoSao Tome and PrincipeSenegalSerbiaSeychellesSierra LeoneSingaporeSlovak RepublicSloveniaSmall statesSolomon IslandsSouth AfricaSouth AsiaSouth Asia (IDA & IBRD)SpainSri LankaSt. Kitts and NevisSt. LuciaSub-Saharan Africa Sub-Saharan Africa (excluding high income)Sub-Saharan Africa (IDA & IBRD countries)SurinameSwazilandSwedenSwitzerlandSyrian Arab RepublicTajikistanTanzaniaThailandTimor-LesteTogoTrinidad and TobagoTunisiaTurkeyUgandaUkraineUnited Arab EmiratesUnited KingdomUnited StatesUpper middle incomeUruguayVanuatuVenezuela, RBVietnamWest Bank and GazaWorldYemen, Rep.ZambiaZimbabwe Timeline:
This timeline shows a graph from 1973 to 2015 of Germany. No data until 1972. Number of actual observations by date: 43.
Source name:
World Development Indicators
Source organization:
International Monetary Fund, Government Finance Statistics Yearbook and data files.
Categories, topics:
Public Sector
Last updated:
apr 23, 2017
Indicators value changes by year
Minimum:
19.957
jan 1, 1998
Maximum:
28.331
jan 1, 1973
At the date of observation
Value
Absolute change
Change from previous value
jan 1, 1973
28.331
+28.331
0.0%
jan 1, 1974
26.591
-1.739
-6.14%
jan 1, 1975
24.604
-1.987
-7.47%
jan 1, 1976
24.539
-0.065
-0.26%
jan 1, 1977
23.906
-0.634
-2.58%
jan 1, 1978
23.03
-0.876
-3.66%
jan 1, 1979
23.652
+0.622
2.7%
jan 1, 1980
24.154
+0.502
2.12%
jan 1, 1981
23.113
-1.041
-4.31%
jan 1, 1982
22.758
-0.355
-1.54%
jan 1, 1983
21.395
-1.363
-5.99%
jan 1, 1984
21.991
+0.595
2.78%
jan 1, 1985
23.347
+1.356
6.17%
jan 1, 1986
22.315
-1.032
-4.42%
jan 1, 1987
21.857
-0.458
-2.05%
jan 1, 1988
22.42
+0.562
2.57%
jan 1, 1989
22.623
+0.204
0.91%
jan 1, 1990
23.113
+0.489
2.16%
jan 1, 1991
23.848
+0.735
3.18%
jan 1, 1992
23.877
+0.029
0.12%
jan 1, 1993
23.102
-0.775
-3.25%
jan 1, 1994
23.116
+0.014
0.06%
jan 1, 1995
23.621
+0.506
2.19%
jan 1, 1996
21.715
-1.906
-8.07%
jan 1, 1997
20.314
-1.401
-6.45%
jan 1, 1998
19.957
-0.357
-1.76%
jan 1, 1999
20.257
+0.3
1.5%
jan 1, 2000
21.302
+1.045
5.16%
jan 1, 2001
21.573
+0.271
1.27%
jan 1, 2002
22.136
+0.563
2.61%
jan 1, 2003
22.345
+0.209
0.94%
jan 1, 2004
22.58
+0.235
1.05%
jan 1, 2005
22.37
-0.21
-0.93%
jan 1, 2006
22.813
+0.443
1.98%
jan 1, 2007
22.714
-0.098
-0.43%
jan 1, 2008
23.997
+1.283
5.65%
jan 1, 2009
23.82
-0.177
-0.74%
jan 1, 2010
24.576
+0.756
3.17%
jan 1, 2011
24.619
+0.043
0.17%
jan 1, 2012
24.799
+0.18
0.73%
jan 1, 2013
24.29
-0.509
-2.05%
jan 1, 2014
23.865
-0.425
-1.75%
jan 1, 2015
23.554
-0.311
-1.3%
Ranking of countries by current statistics by years


Comments: