29
/
en
AIzaSyAYiBZKx7MnpbEhh9jyipgxe19OcubqV5w
April 1, 2024
33911
European Union
EUU
false
2
1
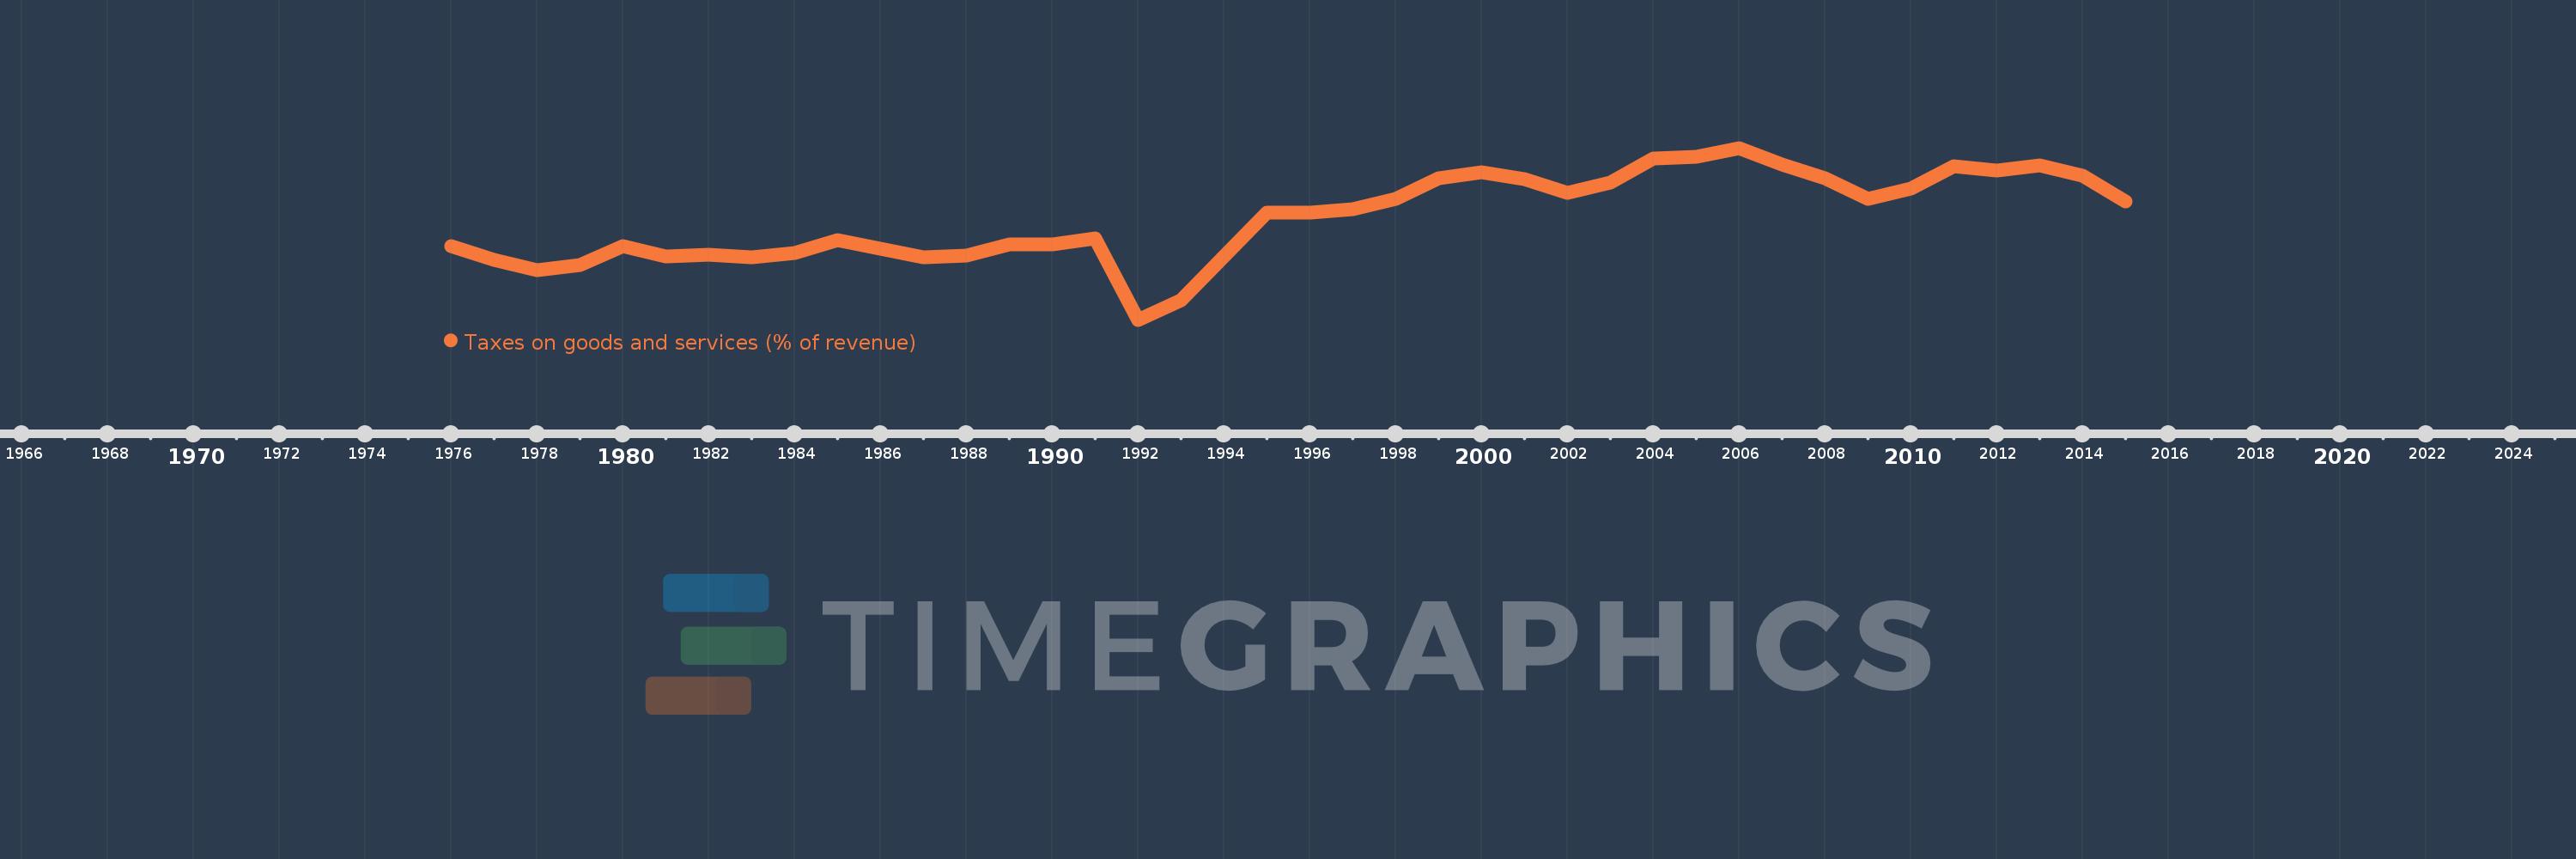
Taxes on goods and services (% of revenue)
2015,2014,2013,2012,2011,2010,2009,2008,2007,2006,2005,2004,2003,2002,2001,2000,1999,1998,1997,1996,1995,1994,1993,1992,1991,1990,1989,1988,1987,1986,1985,1984,1983,1982,1981,1980,1979,1978,1977,1976
This statistics in other country:
AfghanistanAlbaniaAlgeriaAngolaAntigua and BarbudaArab WorldArgentinaArmeniaAustraliaAustriaAzerbaijanBahamas, TheBahrainBangladeshBarbadosBelarusBelgiumBelizeBeninBhutanBoliviaBosnia and HerzegovinaBotswanaBrazilBulgariaBurkina FasoBurundiCabo VerdeCambodiaCanadaCaribbean small statesCentral African RepublicCentral Europe and the BalticsChileChinaColombiaCongo, Dem. Rep.Congo, Rep.Costa RicaCote d'IvoireCroatiaCyprusCzech RepublicDenmarkDominicaDominican RepublicEarly-demographic dividendEast Asia & PacificEast Asia & Pacific (excluding high income)East Asia & Pacific (IDA & IBRD countries)Egypt, Arab Rep.El SalvadorEquatorial GuineaEstoniaEthiopiaEuro areaEurope & Central AsiaEurope & Central Asia (excluding high income)Europe & Central Asia (IDA & IBRD countries)European UnionFijiFinlandFranceGambia, TheGeorgiaGermanyGhanaGreeceGrenadaGuatemalaHeavily indebted poor countries (HIPC)High incomeHondurasHong Kong SAR, ChinaHungaryIBRD onlyIcelandIDA & IBRD totalIDA blendIDA onlyIDA totalIndiaIndonesiaIran, Islamic Rep.IraqIrelandIsraelItalyJamaicaJapanJordanKazakhstanKenyaKiribatiKorea, Rep.KuwaitKyrgyz RepublicLao PDRLate-demographic dividendLatin America & Caribbean Latin America & Caribbean (excluding high income)Latin America & the Caribbean (IDA & IBRD countries)LatviaLeast developed countries: UN classificationLebanonLesothoLiberiaLithuaniaLow & middle incomeLow incomeLower middle incomeLuxembourgMacao SAR, ChinaMacedonia, FYRMadagascarMalawiMalaysiaMaldivesMaliMaltaMauritiusMexicoMicronesia, Fed. Sts.Middle East & North AfricaMiddle East & North Africa (excluding high income)Middle East & North Africa (IDA & IBRD countries)Middle incomeMoldovaMongoliaMoroccoMozambiqueMyanmarNamibiaNepalNetherlandsNew ZealandNicaraguaNigeriaNorth AmericaNorwayOECD membersOmanOther small statesPakistanPanamaPapua New GuineaParaguayPeruPhilippinesPolandPortugalPost-demographic dividendPre-demographic dividendRomaniaRussian FederationRwandaSamoaSan MarinoSao Tome and PrincipeSenegalSerbiaSeychellesSierra LeoneSingaporeSlovak RepublicSloveniaSmall statesSolomon IslandsSouth AfricaSouth AsiaSouth Asia (IDA & IBRD)SpainSri LankaSt. Kitts and NevisSt. LuciaSub-Saharan Africa Sub-Saharan Africa (excluding high income)Sub-Saharan Africa (IDA & IBRD countries)SurinameSwazilandSwedenSwitzerlandSyrian Arab RepublicTajikistanTanzaniaThailandTimor-LesteTogoTrinidad and TobagoTunisiaTurkeyUgandaUkraineUnited Arab EmiratesUnited KingdomUnited StatesUpper middle incomeUruguayVanuatuVenezuela, RBVietnamWest Bank and GazaWorldYemen, Rep.ZambiaZimbabwe Timeline:
This timeline shows a graph from 1976 to 2015 of European Union. No data until 1975. Number of actual observations by date: 40.
Source name:
World Development Indicators
Source organization:
International Monetary Fund, Government Finance Statistics Yearbook and data files.
Categories, topics:
Public Sector
Last updated:
apr 23, 2017
Indicators value changes by year
Minimum:
26.277
jan 1, 1992
Maximum:
35.403
jan 1, 2006
At the date of observation
Value
Absolute change
Change from previous value
jan 1, 1976
30.167
+30.167
0.0%
jan 1, 1977
29.462
-0.705
-2.34%
jan 1, 1978
28.894
-0.568
-1.93%
jan 1, 1979
29.195
+0.301
1.04%
jan 1, 1980
30.186
+0.991
3.39%
jan 1, 1981
29.644
-0.542
-1.79%
jan 1, 1982
29.711
+0.067
0.23%
jan 1, 1983
29.595
-0.116
-0.39%
jan 1, 1984
29.837
+0.242
0.82%
jan 1, 1985
30.514
+0.677
2.27%
jan 1, 1986
30.051
-0.463
-1.52%
jan 1, 1987
29.614
-0.437
-1.45%
jan 1, 1988
29.68
+0.066
0.22%
jan 1, 1989
30.284
+0.604
2.04%
jan 1, 1990
30.29
+0.005
0.02%
jan 1, 1991
30.6
+0.31
1.02%
jan 1, 1992
26.277
-4.323
-14.13%
jan 1, 1993
27.293
+1.017
3.87%
jan 1, 1994
29.643
+2.35
8.61%
jan 1, 1995
31.988
+2.345
7.91%
jan 1, 1996
31.969
-0.019
-0.06%
jan 1, 1997
32.169
+0.2
0.63%
jan 1, 1998
32.696
+0.526
1.64%
jan 1, 1999
33.802
+1.106
3.38%
jan 1, 2000
34.133
+0.331
0.98%
jan 1, 2001
33.732
-0.401
-1.17%
jan 1, 2002
33.037
-0.695
-2.06%
jan 1, 2003
33.556
+0.519
1.57%
jan 1, 2004
34.842
+1.286
3.83%
jan 1, 2005
34.911
+0.069
0.2%
jan 1, 2006
35.403
+0.492
1.41%
jan 1, 2007
34.522
-0.881
-2.49%
jan 1, 2008
33.798
-0.724
-2.1%
jan 1, 2009
32.711
-1.088
-3.22%
jan 1, 2010
33.224
+0.514
1.57%
jan 1, 2011
34.423
+1.199
3.61%
jan 1, 2012
34.216
-0.207
-0.6%
jan 1, 2013
34.482
+0.266
0.78%
jan 1, 2014
33.951
-0.531
-1.54%
jan 1, 2015
32.582
-1.369
-4.03%
Ranking of countries by current statistics by years


Comments: