29
/
en
AIzaSyAYiBZKx7MnpbEhh9jyipgxe19OcubqV5w
April 1, 2024
125586
Egypt, Arab Rep.
EGY
true
2
1
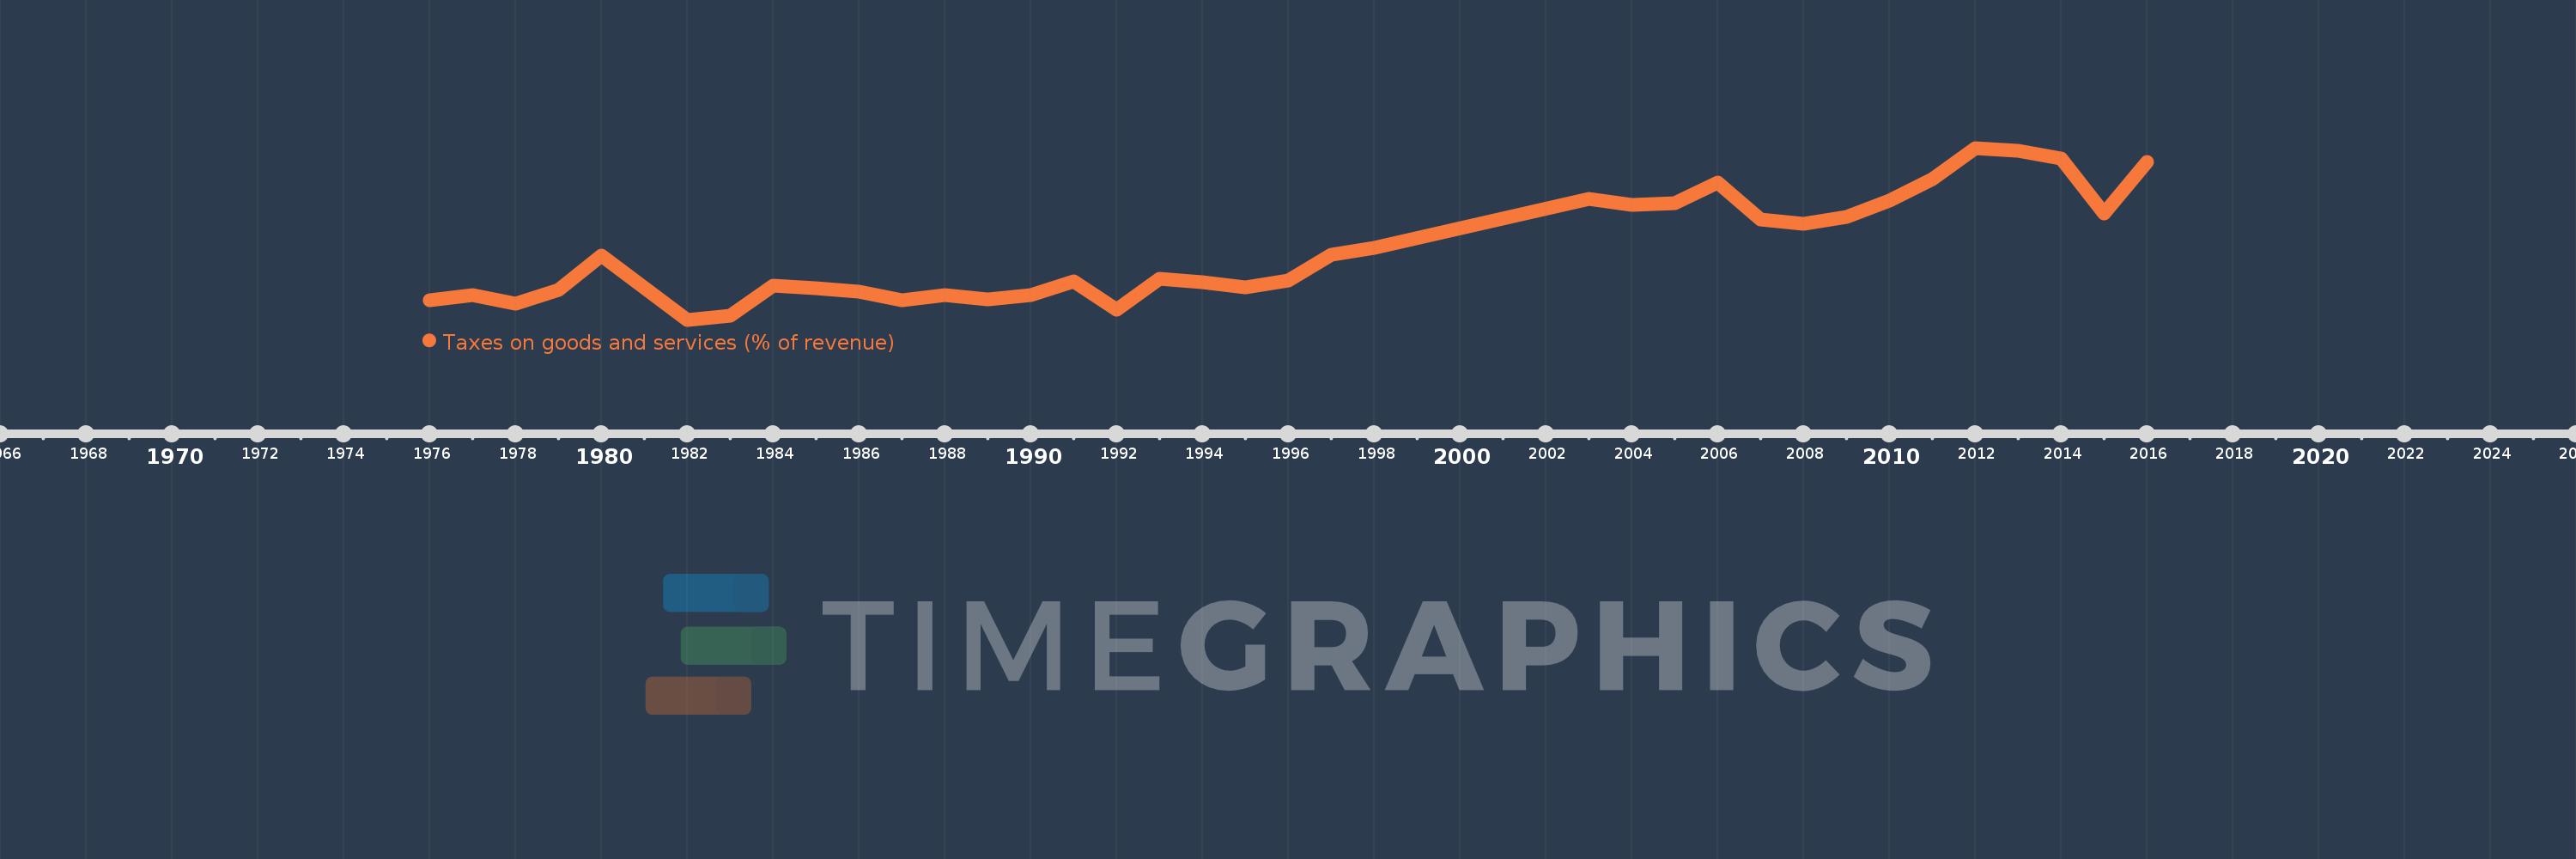
Taxes on goods and services (% of revenue)
2016,2015,2014,2013,2012,2011,2010,2009,2008,2007,2006,2005,2004,2003,1998,1997,1996,1995,1994,1993,1992,1991,1990,1989,1988,1987,1986,1985,1984,1983,1982,1980,1979,1978,1977,1976
This statistics in other country:
AfghanistanAlbaniaAlgeriaAngolaAntigua and BarbudaArab WorldArgentinaArmeniaAustraliaAustriaAzerbaijanBahamas, TheBahrainBangladeshBarbadosBelarusBelgiumBelizeBeninBhutanBoliviaBosnia and HerzegovinaBotswanaBrazilBulgariaBurkina FasoBurundiCabo VerdeCambodiaCanadaCaribbean small statesCentral African RepublicCentral Europe and the BalticsChileChinaColombiaCongo, Dem. Rep.Congo, Rep.Costa RicaCote d'IvoireCroatiaCyprusCzech RepublicDenmarkDominicaDominican RepublicEarly-demographic dividendEast Asia & PacificEast Asia & Pacific (excluding high income)East Asia & Pacific (IDA & IBRD countries)Egypt, Arab Rep.El SalvadorEquatorial GuineaEstoniaEthiopiaEuro areaEurope & Central AsiaEurope & Central Asia (excluding high income)Europe & Central Asia (IDA & IBRD countries)European UnionFijiFinlandFranceGambia, TheGeorgiaGermanyGhanaGreeceGrenadaGuatemalaHeavily indebted poor countries (HIPC)High incomeHondurasHong Kong SAR, ChinaHungaryIBRD onlyIcelandIDA & IBRD totalIDA blendIDA onlyIDA totalIndiaIndonesiaIran, Islamic Rep.IraqIrelandIsraelItalyJamaicaJapanJordanKazakhstanKenyaKiribatiKorea, Rep.KuwaitKyrgyz RepublicLao PDRLate-demographic dividendLatin America & Caribbean Latin America & Caribbean (excluding high income)Latin America & the Caribbean (IDA & IBRD countries)LatviaLeast developed countries: UN classificationLebanonLesothoLiberiaLithuaniaLow & middle incomeLow incomeLower middle incomeLuxembourgMacao SAR, ChinaMacedonia, FYRMadagascarMalawiMalaysiaMaldivesMaliMaltaMauritiusMexicoMicronesia, Fed. Sts.Middle East & North AfricaMiddle East & North Africa (excluding high income)Middle East & North Africa (IDA & IBRD countries)Middle incomeMoldovaMongoliaMoroccoMozambiqueMyanmarNamibiaNepalNetherlandsNew ZealandNicaraguaNigeriaNorth AmericaNorwayOECD membersOmanOther small statesPakistanPanamaPapua New GuineaParaguayPeruPhilippinesPolandPortugalPost-demographic dividendPre-demographic dividendRomaniaRussian FederationRwandaSamoaSan MarinoSao Tome and PrincipeSenegalSerbiaSeychellesSierra LeoneSingaporeSlovak RepublicSloveniaSmall statesSolomon IslandsSouth AfricaSouth AsiaSouth Asia (IDA & IBRD)SpainSri LankaSt. Kitts and NevisSt. LuciaSub-Saharan Africa Sub-Saharan Africa (excluding high income)Sub-Saharan Africa (IDA & IBRD countries)SurinameSwazilandSwedenSwitzerlandSyrian Arab RepublicTajikistanTanzaniaThailandTimor-LesteTogoTrinidad and TobagoTunisiaTurkeyUgandaUkraineUnited Arab EmiratesUnited KingdomUnited StatesUpper middle incomeUruguayVanuatuVenezuela, RBVietnamWest Bank and GazaWorldYemen, Rep.ZambiaZimbabwe Timeline:
This timeline shows a graph from 1976 to 2016 of Egypt, Arab Rep.. No data until 1975. Number of actual observations by date: 36.
Source name:
World Development Indicators
Source organization:
International Monetary Fund, Government Finance Statistics Yearbook and data files.
Categories, topics:
Public Sector
Last updated:
apr 23, 2017
Indicators value changes by year
Maximum:
27.612
jan 1, 2012
At the date of observation
Value
Absolute change
Change from previous value
jan 1, 1976
11.186
+11.186
0.0%
jan 1, 1977
11.757
+0.572
5.11%
jan 1, 1978
10.815
-0.943
-8.02%
jan 1, 1979
12.255
+1.44
13.32%
jan 1, 1980
15.952
+3.697
30.17%
jan 1, 1982
9.071
-6.881
-43.13%
jan 1, 1983
9.511
+0.439
4.84%
jan 1, 1984
12.722
+3.211
33.76%
jan 1, 1985
12.484
-0.237
-1.87%
jan 1, 1986
12.072
-0.412
-3.3%
jan 1, 1987
11.18
-0.892
-7.39%
jan 1, 1988
11.694
+0.513
4.59%
jan 1, 1989
11.239
-0.455
-3.89%
jan 1, 1990
11.764
+0.525
4.67%
jan 1, 1991
13.239
+1.475
12.54%
jan 1, 1992
10.11
-3.129
-23.64%
jan 1, 1993
13.492
+3.382
33.46%
jan 1, 1994
13.139
-0.353
-2.62%
jan 1, 1995
12.534
-0.605
-4.6%
jan 1, 1996
13.343
+0.809
6.46%
jan 1, 1997
16.1
+2.757
20.67%
jan 1, 1998
16.816
+0.715
4.44%
jan 1, 2003
22.139
+5.323
31.66%
jan 1, 2004
21.501
-0.638
-2.88%
jan 1, 2005
21.647
+0.146
0.68%
jan 1, 2006
23.88
+2.234
10.32%
jan 1, 2007
19.909
-3.971
-16.63%
jan 1, 2008
19.4
-0.509
-2.56%
jan 1, 2009
20.207
+0.807
4.16%
jan 1, 2010
21.902
+1.695
8.39%
jan 1, 2011
24.231
+2.329
10.63%
jan 1, 2012
27.612
+3.381
13.95%
jan 1, 2013
27.28
-0.332
-1.2%
jan 1, 2014
26.467
-0.813
-2.98%
jan 1, 2015
20.553
-5.914
-22.34%
jan 1, 2016
26.108
+5.555
27.03%
Ranking of countries by current statistics by years


Comments: