29
/
en
AIzaSyAYiBZKx7MnpbEhh9jyipgxe19OcubqV5w
April 1, 2024
208495
Netherlands
NLD
true
2
1
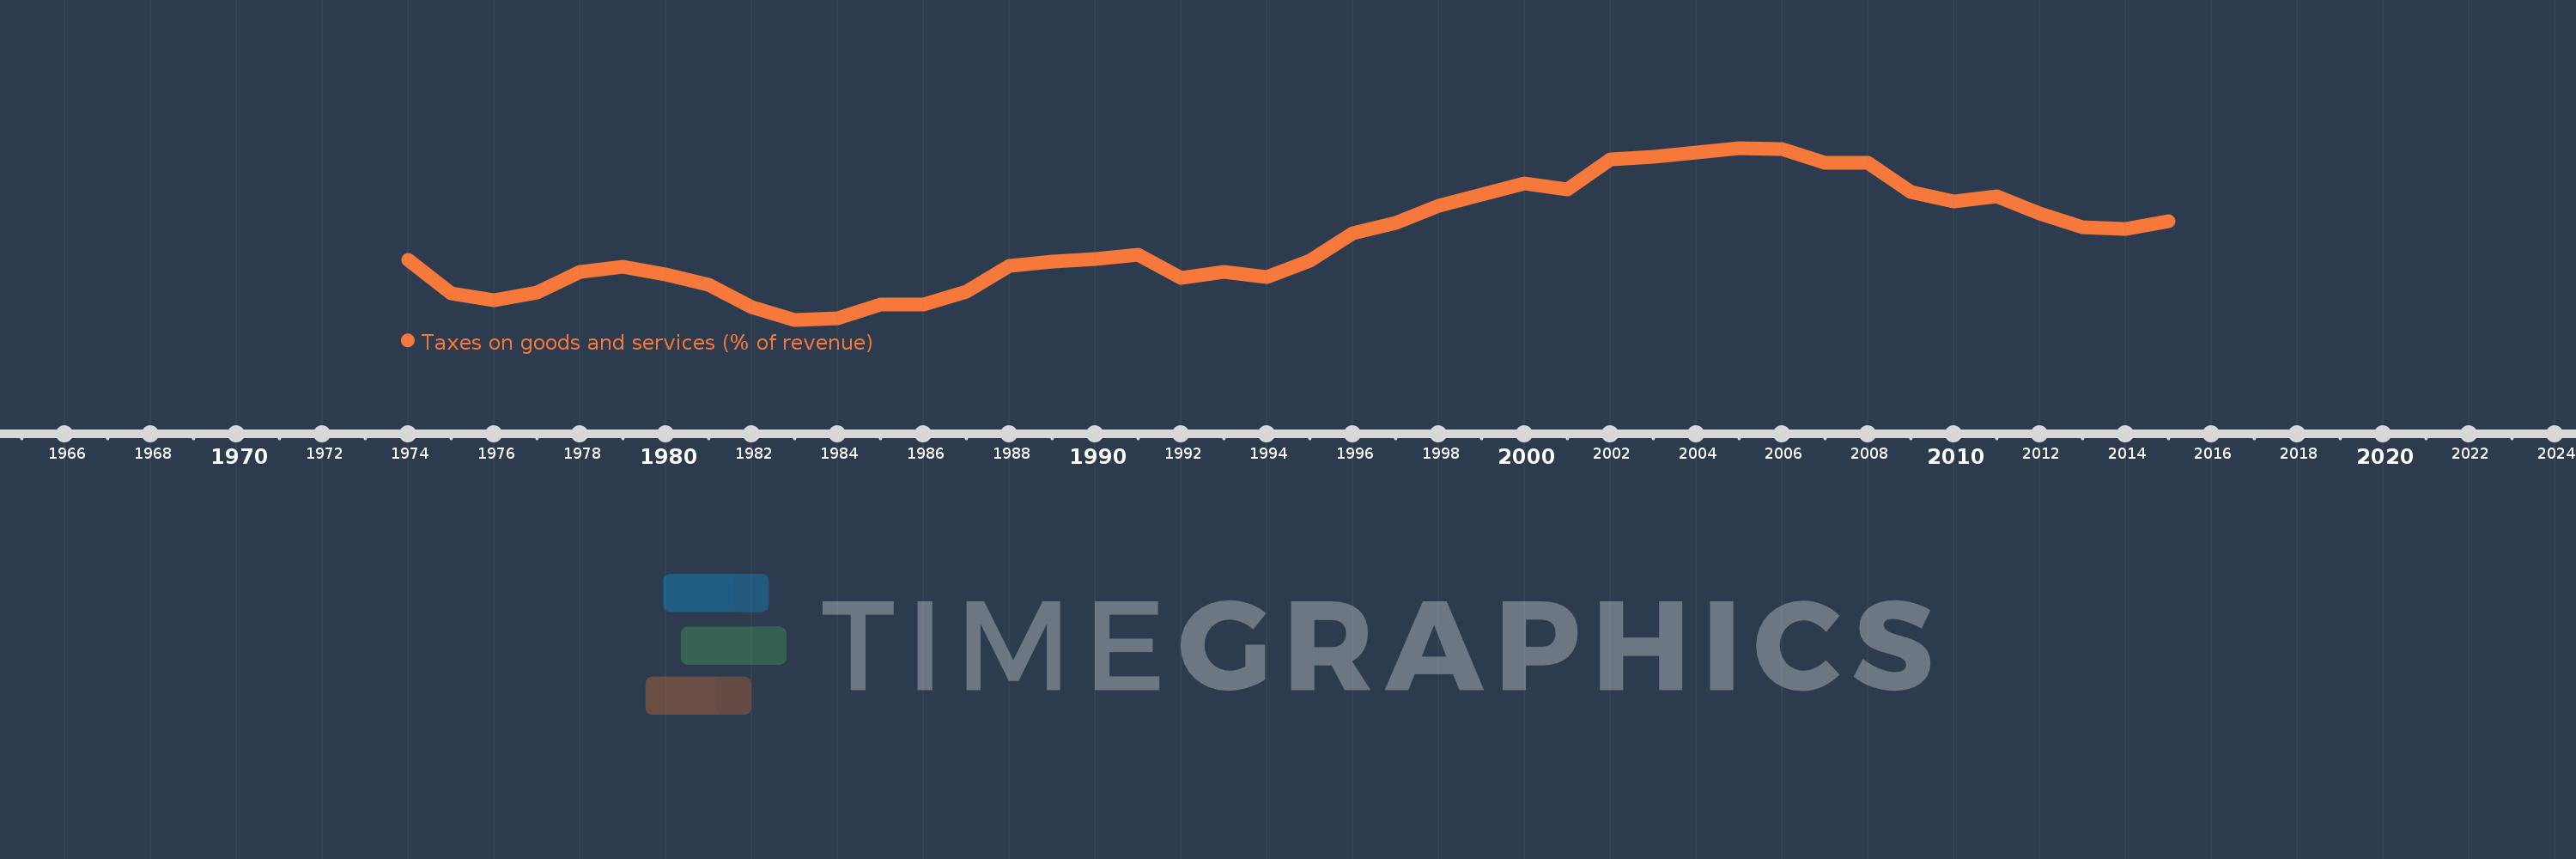
Taxes on goods and services (% of revenue)
2015,2014,2013,2012,2011,2010,2009,2008,2007,2006,2005,2004,2003,2002,2001,2000,1999,1998,1997,1996,1995,1994,1993,1992,1991,1990,1989,1988,1987,1986,1985,1984,1983,1982,1981,1980,1979,1978,1977,1976,1975,1974
This statistics in other country:
AfghanistanAlbaniaAlgeriaAngolaAntigua and BarbudaArab WorldArgentinaArmeniaAustraliaAustriaAzerbaijanBahamas, TheBahrainBangladeshBarbadosBelarusBelgiumBelizeBeninBhutanBoliviaBosnia and HerzegovinaBotswanaBrazilBulgariaBurkina FasoBurundiCabo VerdeCambodiaCanadaCaribbean small statesCentral African RepublicCentral Europe and the BalticsChileChinaColombiaCongo, Dem. Rep.Congo, Rep.Costa RicaCote d'IvoireCroatiaCyprusCzech RepublicDenmarkDominicaDominican RepublicEarly-demographic dividendEast Asia & PacificEast Asia & Pacific (excluding high income)East Asia & Pacific (IDA & IBRD countries)Egypt, Arab Rep.El SalvadorEquatorial GuineaEstoniaEthiopiaEuro areaEurope & Central AsiaEurope & Central Asia (excluding high income)Europe & Central Asia (IDA & IBRD countries)European UnionFijiFinlandFranceGambia, TheGeorgiaGermanyGhanaGreeceGrenadaGuatemalaHeavily indebted poor countries (HIPC)High incomeHondurasHong Kong SAR, ChinaHungaryIBRD onlyIcelandIDA & IBRD totalIDA blendIDA onlyIDA totalIndiaIndonesiaIran, Islamic Rep.IraqIrelandIsraelItalyJamaicaJapanJordanKazakhstanKenyaKiribatiKorea, Rep.KuwaitKyrgyz RepublicLao PDRLate-demographic dividendLatin America & Caribbean Latin America & Caribbean (excluding high income)Latin America & the Caribbean (IDA & IBRD countries)LatviaLeast developed countries: UN classificationLebanonLesothoLiberiaLithuaniaLow & middle incomeLow incomeLower middle incomeLuxembourgMacao SAR, ChinaMacedonia, FYRMadagascarMalawiMalaysiaMaldivesMaliMaltaMauritiusMexicoMicronesia, Fed. Sts.Middle East & North AfricaMiddle East & North Africa (excluding high income)Middle East & North Africa (IDA & IBRD countries)Middle incomeMoldovaMongoliaMoroccoMozambiqueMyanmarNamibiaNepalNetherlandsNew ZealandNicaraguaNigeriaNorth AmericaNorwayOECD membersOmanOther small statesPakistanPanamaPapua New GuineaParaguayPeruPhilippinesPolandPortugalPost-demographic dividendPre-demographic dividendRomaniaRussian FederationRwandaSamoaSan MarinoSao Tome and PrincipeSenegalSerbiaSeychellesSierra LeoneSingaporeSlovak RepublicSloveniaSmall statesSolomon IslandsSouth AfricaSouth AsiaSouth Asia (IDA & IBRD)SpainSri LankaSt. Kitts and NevisSt. LuciaSub-Saharan Africa Sub-Saharan Africa (excluding high income)Sub-Saharan Africa (IDA & IBRD countries)SurinameSwazilandSwedenSwitzerlandSyrian Arab RepublicTajikistanTanzaniaThailandTimor-LesteTogoTrinidad and TobagoTunisiaTurkeyUgandaUkraineUnited Arab EmiratesUnited KingdomUnited StatesUpper middle incomeUruguayVanuatuVenezuela, RBVietnamWest Bank and GazaWorldYemen, Rep.ZambiaZimbabwe Timeline:
This timeline shows a graph from 1974 to 2015 of Netherlands. No data until 1973. Number of actual observations by date: 42.
Source name:
World Development Indicators
Source organization:
International Monetary Fund, Government Finance Statistics Yearbook and data files.
Categories, topics:
Public Sector
Last updated:
apr 23, 2017
Indicators value changes by year
Minimum:
19.847
jan 1, 1983
Maximum:
29.405
jan 1, 2005
At the date of observation
Value
Absolute change
Change from previous value
jan 1, 1974
23.168
+23.168
0.0%
jan 1, 1975
21.291
-1.877
-8.1%
jan 1, 1976
20.931
-0.359
-1.69%
jan 1, 1977
21.374
+0.443
2.12%
jan 1, 1978
22.532
+1.158
5.42%
jan 1, 1979
22.775
+0.243
1.08%
jan 1, 1980
22.35
-0.425
-1.87%
jan 1, 1981
21.798
-0.552
-2.47%
jan 1, 1982
20.568
-1.23
-5.64%
jan 1, 1983
19.847
-0.721
-3.5%
jan 1, 1984
19.938
+0.091
0.46%
jan 1, 1985
20.679
+0.741
3.72%
jan 1, 1986
20.708
+0.029
0.14%
jan 1, 1987
21.421
+0.713
3.44%
jan 1, 1988
22.832
+1.411
6.59%
jan 1, 1989
23.083
+0.251
1.1%
jan 1, 1990
23.241
+0.158
0.68%
jan 1, 1991
23.447
+0.206
0.89%
jan 1, 1992
22.153
-1.294
-5.52%
jan 1, 1993
22.494
+0.34
1.54%
jan 1, 1994
22.211
-0.283
-1.26%
jan 1, 1995
23.132
+0.921
4.15%
jan 1, 1996
24.647
+1.515
6.55%
jan 1, 1997
25.23
+0.583
2.36%
jan 1, 1998
26.19
+0.96
3.81%
jan 1, 1999
26.809
+0.619
2.36%
jan 1, 2000
27.418
+0.609
2.27%
jan 1, 2001
27.116
-0.302
-1.1%
jan 1, 2002
28.781
+1.666
6.14%
jan 1, 2003
28.906
+0.125
0.43%
jan 1, 2004
29.161
+0.255
0.88%
jan 1, 2005
29.405
+0.245
0.84%
jan 1, 2006
29.329
-0.076
-0.26%
jan 1, 2007
28.565
-0.764
-2.61%
jan 1, 2008
28.586
+0.021
0.07%
jan 1, 2009
26.962
-1.623
-5.68%
jan 1, 2010
26.449
-0.514
-1.9%
jan 1, 2011
26.721
+0.272
1.03%
jan 1, 2012
25.754
-0.967
-3.62%
jan 1, 2013
25.014
-0.739
-2.87%
jan 1, 2014
24.875
-0.139
-0.56%
jan 1, 2015
25.325
+0.45
1.81%
Ranking of countries by current statistics by years


Comments: