29
/
en
AIzaSyAYiBZKx7MnpbEhh9jyipgxe19OcubqV5w
April 1, 2024
276218
United Kingdom
GBR
true
2
1
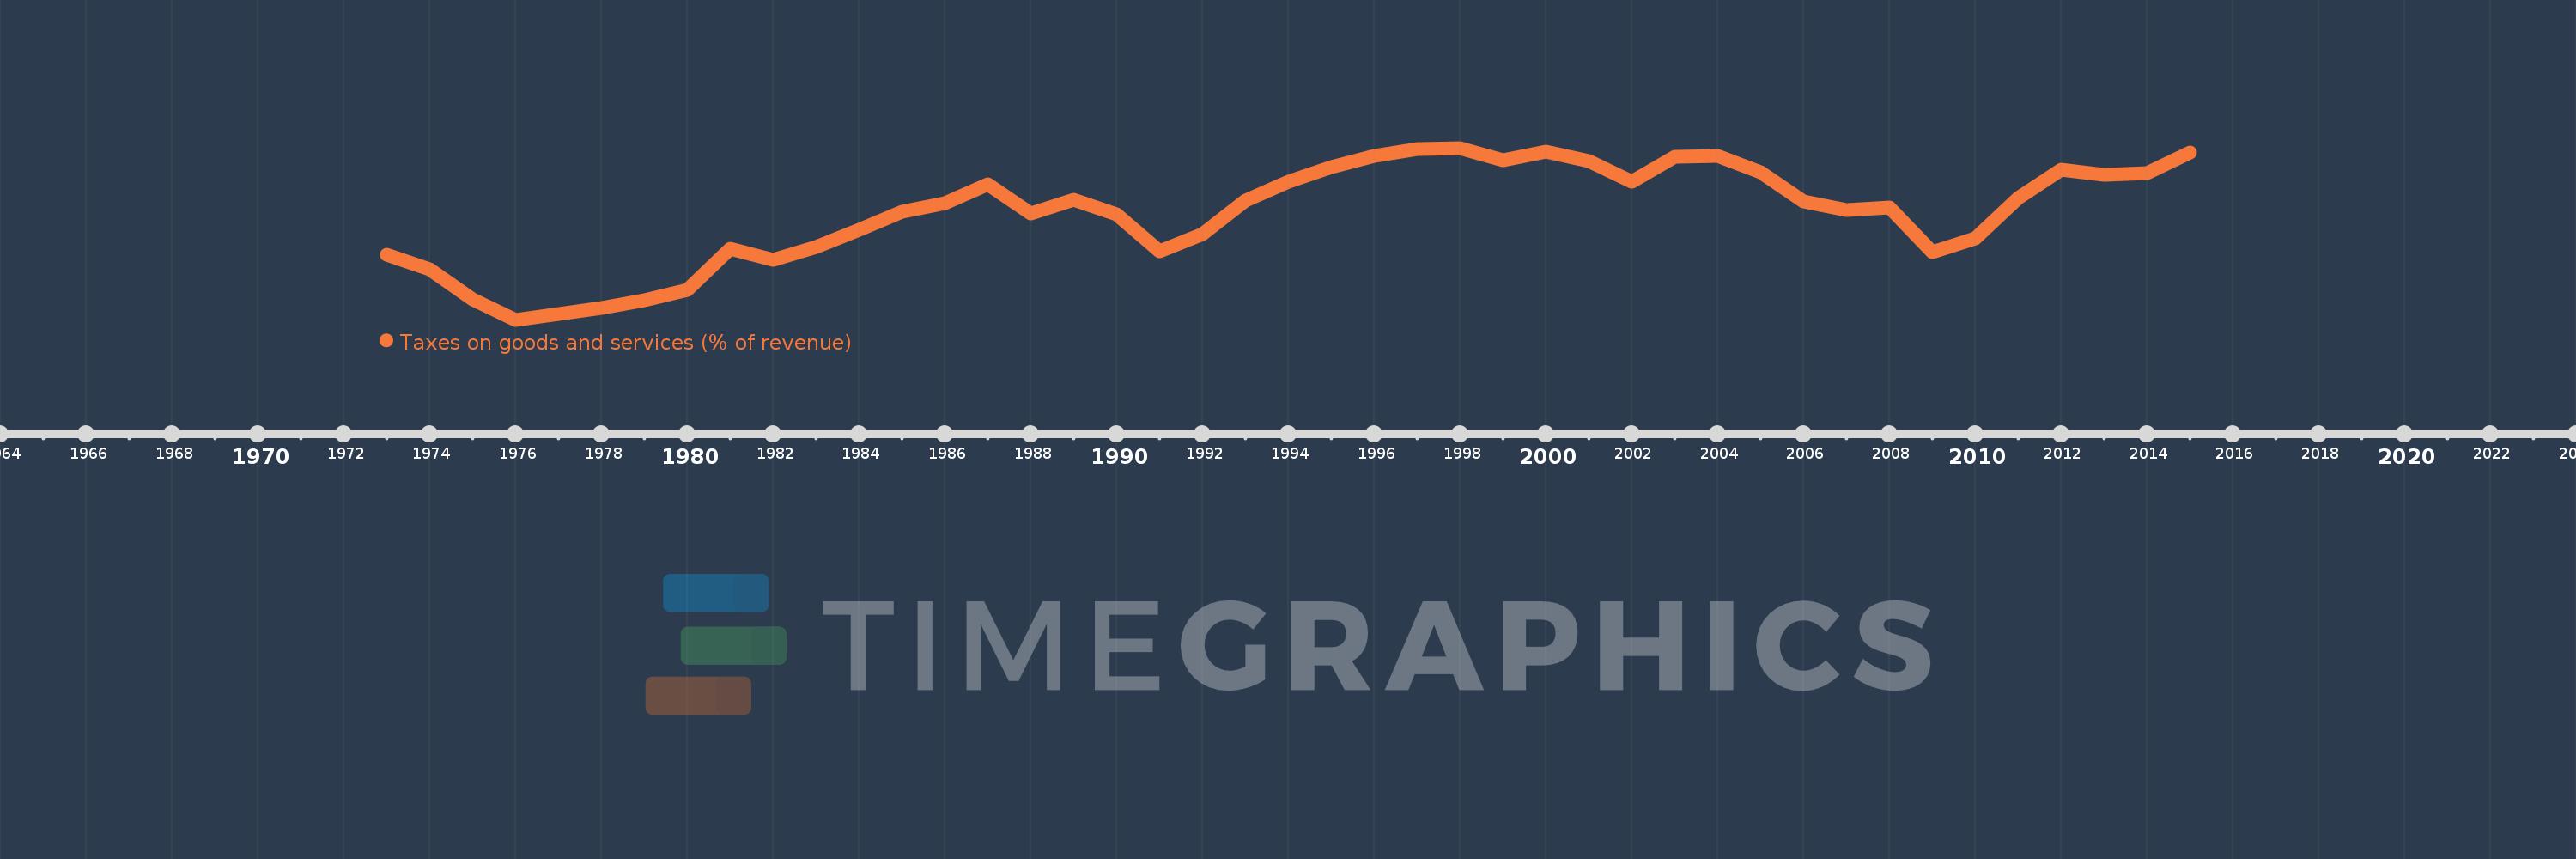
Taxes on goods and services (% of revenue)
2015,2014,2013,2012,2011,2010,2009,2008,2007,2006,2005,2004,2003,2002,2001,2000,1999,1998,1997,1996,1995,1994,1993,1992,1991,1990,1989,1988,1987,1986,1985,1984,1983,1982,1981,1980,1979,1978,1977,1976,1975,1974,1973
This statistics in other country:
AfghanistanAlbaniaAlgeriaAngolaAntigua and BarbudaArab WorldArgentinaArmeniaAustraliaAustriaAzerbaijanBahamas, TheBahrainBangladeshBarbadosBelarusBelgiumBelizeBeninBhutanBoliviaBosnia and HerzegovinaBotswanaBrazilBulgariaBurkina FasoBurundiCabo VerdeCambodiaCanadaCaribbean small statesCentral African RepublicCentral Europe and the BalticsChileChinaColombiaCongo, Dem. Rep.Congo, Rep.Costa RicaCote d'IvoireCroatiaCyprusCzech RepublicDenmarkDominicaDominican RepublicEarly-demographic dividendEast Asia & PacificEast Asia & Pacific (excluding high income)East Asia & Pacific (IDA & IBRD countries)Egypt, Arab Rep.El SalvadorEquatorial GuineaEstoniaEthiopiaEuro areaEurope & Central AsiaEurope & Central Asia (excluding high income)Europe & Central Asia (IDA & IBRD countries)European UnionFijiFinlandFranceGambia, TheGeorgiaGermanyGhanaGreeceGrenadaGuatemalaHeavily indebted poor countries (HIPC)High incomeHondurasHong Kong SAR, ChinaHungaryIBRD onlyIcelandIDA & IBRD totalIDA blendIDA onlyIDA totalIndiaIndonesiaIran, Islamic Rep.IraqIrelandIsraelItalyJamaicaJapanJordanKazakhstanKenyaKiribatiKorea, Rep.KuwaitKyrgyz RepublicLao PDRLate-demographic dividendLatin America & Caribbean Latin America & Caribbean (excluding high income)Latin America & the Caribbean (IDA & IBRD countries)LatviaLeast developed countries: UN classificationLebanonLesothoLiberiaLithuaniaLow & middle incomeLow incomeLower middle incomeLuxembourgMacao SAR, ChinaMacedonia, FYRMadagascarMalawiMalaysiaMaldivesMaliMaltaMauritiusMexicoMicronesia, Fed. Sts.Middle East & North AfricaMiddle East & North Africa (excluding high income)Middle East & North Africa (IDA & IBRD countries)Middle incomeMoldovaMongoliaMoroccoMozambiqueMyanmarNamibiaNepalNetherlandsNew ZealandNicaraguaNigeriaNorth AmericaNorwayOECD membersOmanOther small statesPakistanPanamaPapua New GuineaParaguayPeruPhilippinesPolandPortugalPost-demographic dividendPre-demographic dividendRomaniaRussian FederationRwandaSamoaSan MarinoSao Tome and PrincipeSenegalSerbiaSeychellesSierra LeoneSingaporeSlovak RepublicSloveniaSmall statesSolomon IslandsSouth AfricaSouth AsiaSouth Asia (IDA & IBRD)SpainSri LankaSt. Kitts and NevisSt. LuciaSub-Saharan Africa Sub-Saharan Africa (excluding high income)Sub-Saharan Africa (IDA & IBRD countries)SurinameSwazilandSwedenSwitzerlandSyrian Arab RepublicTajikistanTanzaniaThailandTimor-LesteTogoTrinidad and TobagoTunisiaTurkeyUgandaUkraineUnited Arab EmiratesUnited KingdomUnited StatesUpper middle incomeUruguayVanuatuVenezuela, RBVietnamWest Bank and GazaWorldYemen, Rep.ZambiaZimbabwe Timeline:
This timeline shows a graph from 1973 to 2015 of United Kingdom. No data until 1972. Number of actual observations by date: 43.
Source name:
World Development Indicators
Source organization:
International Monetary Fund, Government Finance Statistics Yearbook and data files.
Categories, topics:
Public Sector
Last updated:
apr 23, 2017
Indicators value changes by year
Minimum:
24.538
jan 1, 1976
Maximum:
34.075
jan 1, 1998
At the date of observation
Value
Absolute change
Change from previous value
jan 1, 1973
28.139
+28.139
0.0%
jan 1, 1974
27.325
-0.813
-2.89%
jan 1, 1975
25.663
-1.663
-6.08%
jan 1, 1976
24.538
-1.125
-4.38%
jan 1, 1977
24.848
+0.311
1.27%
jan 1, 1978
25.206
+0.358
1.44%
jan 1, 1979
25.641
+0.435
1.73%
jan 1, 1980
26.207
+0.566
2.21%
jan 1, 1981
28.465
+2.258
8.62%
jan 1, 1982
27.863
-0.603
-2.12%
jan 1, 1983
28.579
+0.716
2.57%
jan 1, 1984
29.531
+0.953
3.33%
jan 1, 1985
30.514
+0.983
3.33%
jan 1, 1986
31.031
+0.517
1.69%
jan 1, 1987
32.046
+1.015
3.27%
jan 1, 1988
30.435
-1.61
-5.03%
jan 1, 1989
31.193
+0.758
2.49%
jan 1, 1990
30.389
-0.804
-2.58%
jan 1, 1991
28.354
-2.036
-6.7%
jan 1, 1992
29.278
+0.924
3.26%
jan 1, 1993
31.151
+1.873
6.4%
jan 1, 1994
32.216
+1.065
3.42%
jan 1, 1995
33.011
+0.795
2.47%
jan 1, 1996
33.63
+0.619
1.88%
jan 1, 1997
34.007
+0.377
1.12%
jan 1, 1998
34.075
+0.068
0.2%
jan 1, 1999
33.377
-0.698
-2.05%
jan 1, 2000
33.879
+0.502
1.5%
jan 1, 2001
33.368
-0.511
-1.51%
jan 1, 2002
32.209
-1.159
-3.47%
jan 1, 2003
33.561
+1.352
4.2%
jan 1, 2004
33.618
+0.058
0.17%
jan 1, 2005
32.745
-0.873
-2.6%
jan 1, 2006
31.114
-1.632
-4.98%
jan 1, 2007
30.614
-0.5
-1.61%
jan 1, 2008
30.763
+0.149
0.49%
jan 1, 2009
28.284
-2.479
-8.06%
jan 1, 2010
29.06
+0.776
2.74%
jan 1, 2011
31.281
+2.221
7.64%
jan 1, 2012
32.862
+1.58
5.05%
jan 1, 2013
32.564
-0.298
-0.91%
jan 1, 2014
32.688
+0.124
0.38%
jan 1, 2015
33.826
+1.138
3.48%
Ranking of countries by current statistics by years


Comments: