29
/
en
AIzaSyAYiBZKx7MnpbEhh9jyipgxe19OcubqV5w
April 1, 2024
52279
North America
NAC
false
2
1
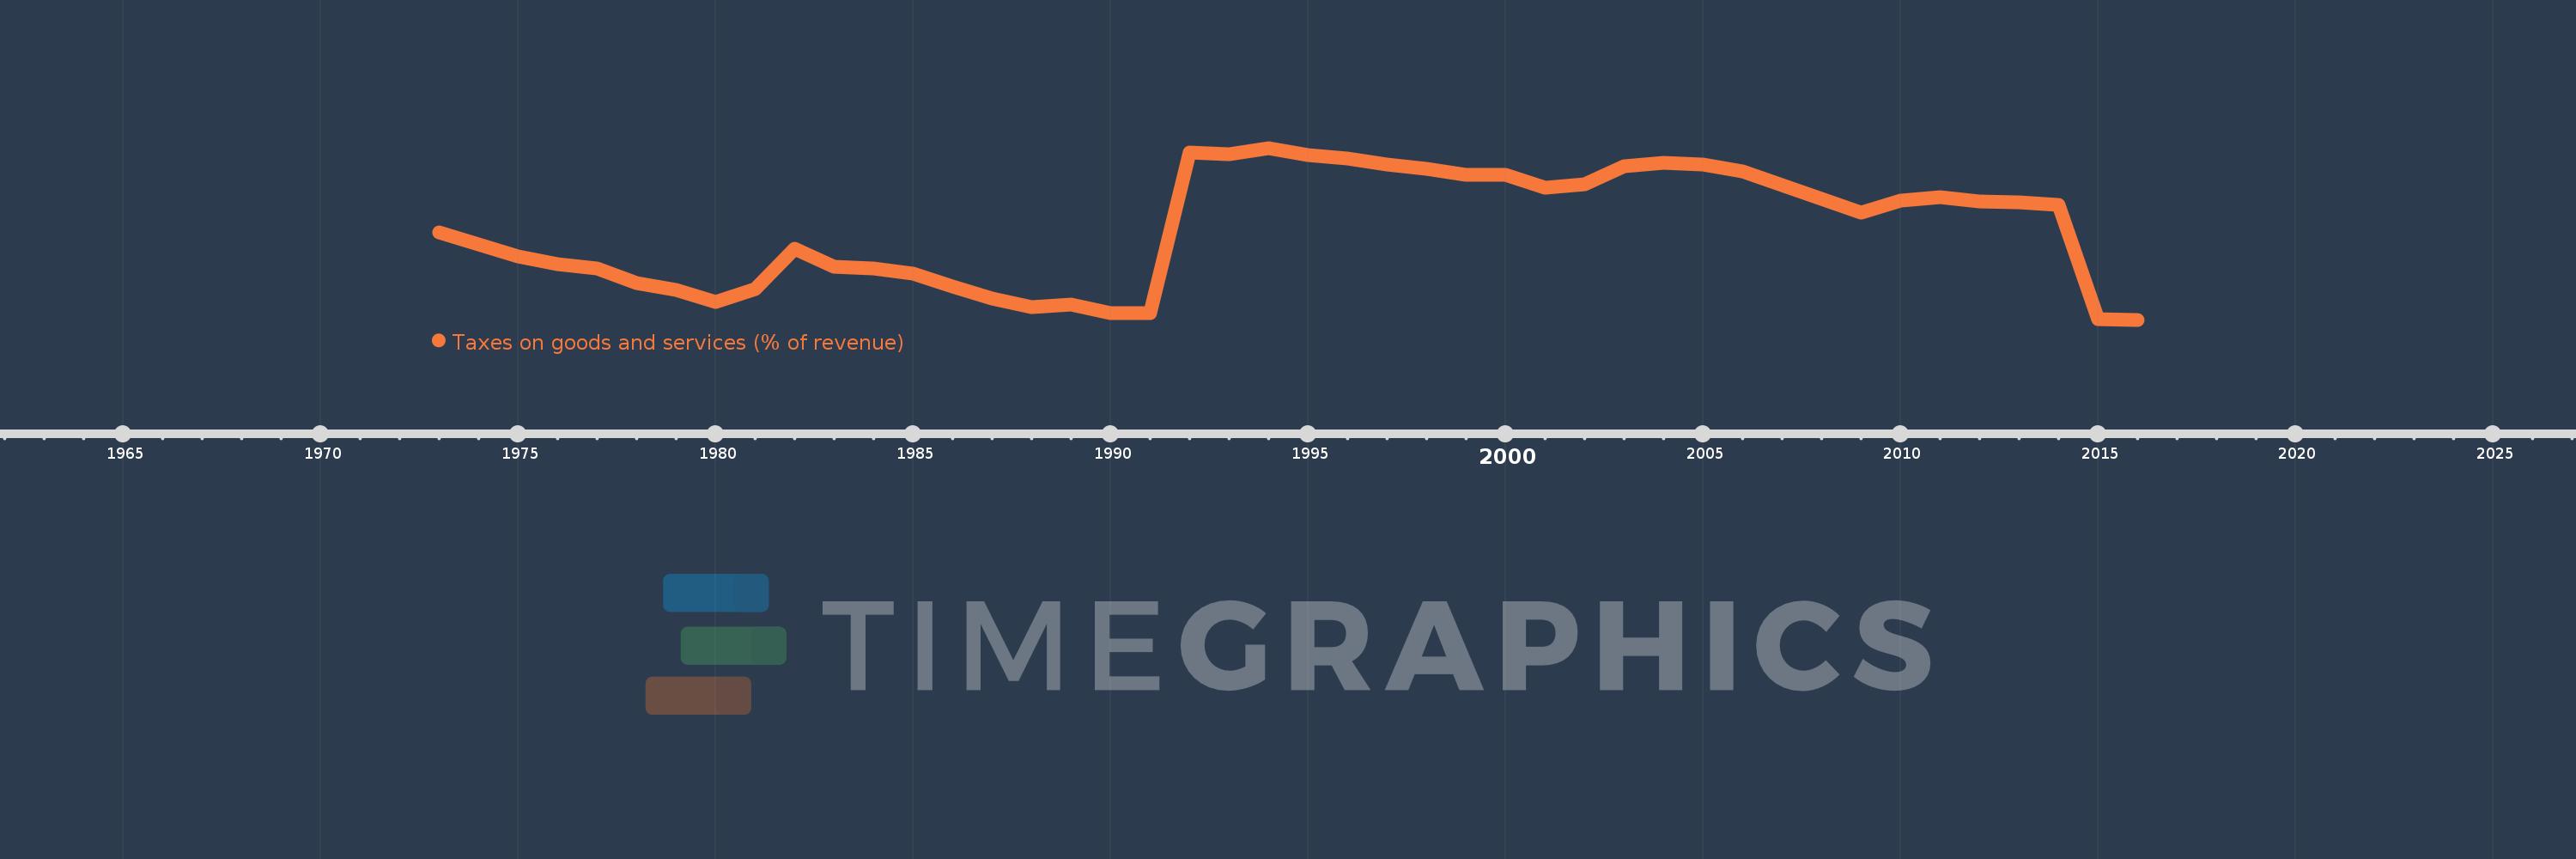
Taxes on goods and services (% of revenue)
2016,2015,2014,2013,2012,2011,2010,2009,2008,2007,2006,2005,2004,2003,2002,2001,2000,1999,1998,1997,1996,1995,1994,1993,1992,1991,1990,1989,1988,1987,1986,1985,1984,1983,1982,1981,1980,1979,1978,1977,1976,1975,1974,1973
This statistics in other country:
AfghanistanAlbaniaAlgeriaAngolaAntigua and BarbudaArab WorldArgentinaArmeniaAustraliaAustriaAzerbaijanBahamas, TheBahrainBangladeshBarbadosBelarusBelgiumBelizeBeninBhutanBoliviaBosnia and HerzegovinaBotswanaBrazilBulgariaBurkina FasoBurundiCabo VerdeCambodiaCanadaCaribbean small statesCentral African RepublicCentral Europe and the BalticsChileChinaColombiaCongo, Dem. Rep.Congo, Rep.Costa RicaCote d'IvoireCroatiaCyprusCzech RepublicDenmarkDominicaDominican RepublicEarly-demographic dividendEast Asia & PacificEast Asia & Pacific (excluding high income)East Asia & Pacific (IDA & IBRD countries)Egypt, Arab Rep.El SalvadorEquatorial GuineaEstoniaEthiopiaEuro areaEurope & Central AsiaEurope & Central Asia (excluding high income)Europe & Central Asia (IDA & IBRD countries)European UnionFijiFinlandFranceGambia, TheGeorgiaGermanyGhanaGreeceGrenadaGuatemalaHeavily indebted poor countries (HIPC)High incomeHondurasHong Kong SAR, ChinaHungaryIBRD onlyIcelandIDA & IBRD totalIDA blendIDA onlyIDA totalIndiaIndonesiaIran, Islamic Rep.IraqIrelandIsraelItalyJamaicaJapanJordanKazakhstanKenyaKiribatiKorea, Rep.KuwaitKyrgyz RepublicLao PDRLate-demographic dividendLatin America & Caribbean Latin America & Caribbean (excluding high income)Latin America & the Caribbean (IDA & IBRD countries)LatviaLeast developed countries: UN classificationLebanonLesothoLiberiaLithuaniaLow & middle incomeLow incomeLower middle incomeLuxembourgMacao SAR, ChinaMacedonia, FYRMadagascarMalawiMalaysiaMaldivesMaliMaltaMauritiusMexicoMicronesia, Fed. Sts.Middle East & North AfricaMiddle East & North Africa (excluding high income)Middle East & North Africa (IDA & IBRD countries)Middle incomeMoldovaMongoliaMoroccoMozambiqueMyanmarNamibiaNepalNetherlandsNew ZealandNicaraguaNigeriaNorth AmericaNorwayOECD membersOmanOther small statesPakistanPanamaPapua New GuineaParaguayPeruPhilippinesPolandPortugalPost-demographic dividendPre-demographic dividendRomaniaRussian FederationRwandaSamoaSan MarinoSao Tome and PrincipeSenegalSerbiaSeychellesSierra LeoneSingaporeSlovak RepublicSloveniaSmall statesSolomon IslandsSouth AfricaSouth AsiaSouth Asia (IDA & IBRD)SpainSri LankaSt. Kitts and NevisSt. LuciaSub-Saharan Africa Sub-Saharan Africa (excluding high income)Sub-Saharan Africa (IDA & IBRD countries)SurinameSwazilandSwedenSwitzerlandSyrian Arab RepublicTajikistanTanzaniaThailandTimor-LesteTogoTrinidad and TobagoTunisiaTurkeyUgandaUkraineUnited Arab EmiratesUnited KingdomUnited StatesUpper middle incomeUruguayVanuatuVenezuela, RBVietnamWest Bank and GazaWorldYemen, Rep.ZambiaZimbabwe Timeline:
This timeline shows a graph from 1973 to 2016 of North America. No data until 1972. Number of actual observations by date: 44.
Source name:
World Development Indicators
Source organization:
International Monetary Fund, Government Finance Statistics Yearbook and data files.
Categories, topics:
Public Sector
Last updated:
apr 23, 2017
Indicators value changes by year
Maximum:
11.278
jan 1, 1994
At the date of observation
Value
Absolute change
Change from previous value
jan 1, 1973
7.144
+7.144
0.0%
jan 1, 1974
6.579
-0.564
-7.9%
jan 1, 1975
5.99
-0.589
-8.96%
jan 1, 1976
5.627
-0.363
-6.06%
jan 1, 1977
5.411
-0.216
-3.85%
jan 1, 1978
4.678
-0.732
-13.54%
jan 1, 1979
4.357
-0.321
-6.86%
jan 1, 1980
3.794
-0.563
-12.91%
jan 1, 1981
4.411
+0.617
16.26%
jan 1, 1982
6.358
+1.947
44.14%
jan 1, 1983
5.479
-0.879
-13.83%
jan 1, 1984
5.385
-0.094
-1.72%
jan 1, 1985
5.158
-0.227
-4.21%
jan 1, 1986
4.507
-0.651
-12.62%
jan 1, 1987
3.947
-0.56
-12.41%
jan 1, 1988
3.518
-0.429
-10.87%
jan 1, 1989
3.638
+0.12
3.41%
jan 1, 1990
3.209
-0.43
-11.81%
jan 1, 1991
3.213
+0.004
0.13%
jan 1, 1992
11.062
+7.849
244.31%
jan 1, 1993
10.989
-0.074
-0.67%
jan 1, 1994
11.278
+0.29
2.63%
jan 1, 1995
10.913
-0.365
-3.23%
jan 1, 1996
10.752
-0.161
-1.47%
jan 1, 1997
10.481
-0.272
-2.53%
jan 1, 1998
10.275
-0.206
-1.96%
jan 1, 1999
9.97
-0.305
-2.96%
jan 1, 2000
9.956
-0.014
-0.14%
jan 1, 2001
9.345
-0.611
-6.14%
jan 1, 2002
9.527
+0.182
1.95%
jan 1, 2003
10.406
+0.878
9.22%
jan 1, 2004
10.559
+0.153
1.47%
jan 1, 2005
10.452
-0.107
-1.01%
jan 1, 2006
10.13
-0.321
-3.08%
jan 1, 2007
9.461
-0.669
-6.6%
jan 1, 2008
8.815
-0.646
-6.83%
jan 1, 2009
8.143
-0.672
-7.63%
jan 1, 2010
8.716
+0.572
7.03%
jan 1, 2011
8.872
+0.156
1.79%
jan 1, 2012
8.663
-0.209
-2.35%
jan 1, 2013
8.623
-0.04
-0.46%
jan 1, 2014
8.513
-0.11
-1.28%
jan 1, 2015
2.93
-5.583
-65.59%
jan 1, 2016
2.907
-0.023
-0.77%
Ranking of countries by current statistics by years


Comments: