29
/
en
AIzaSyAYiBZKx7MnpbEhh9jyipgxe19OcubqV5w
April 1, 2024
256880
Sweden
SWE
true
2
1
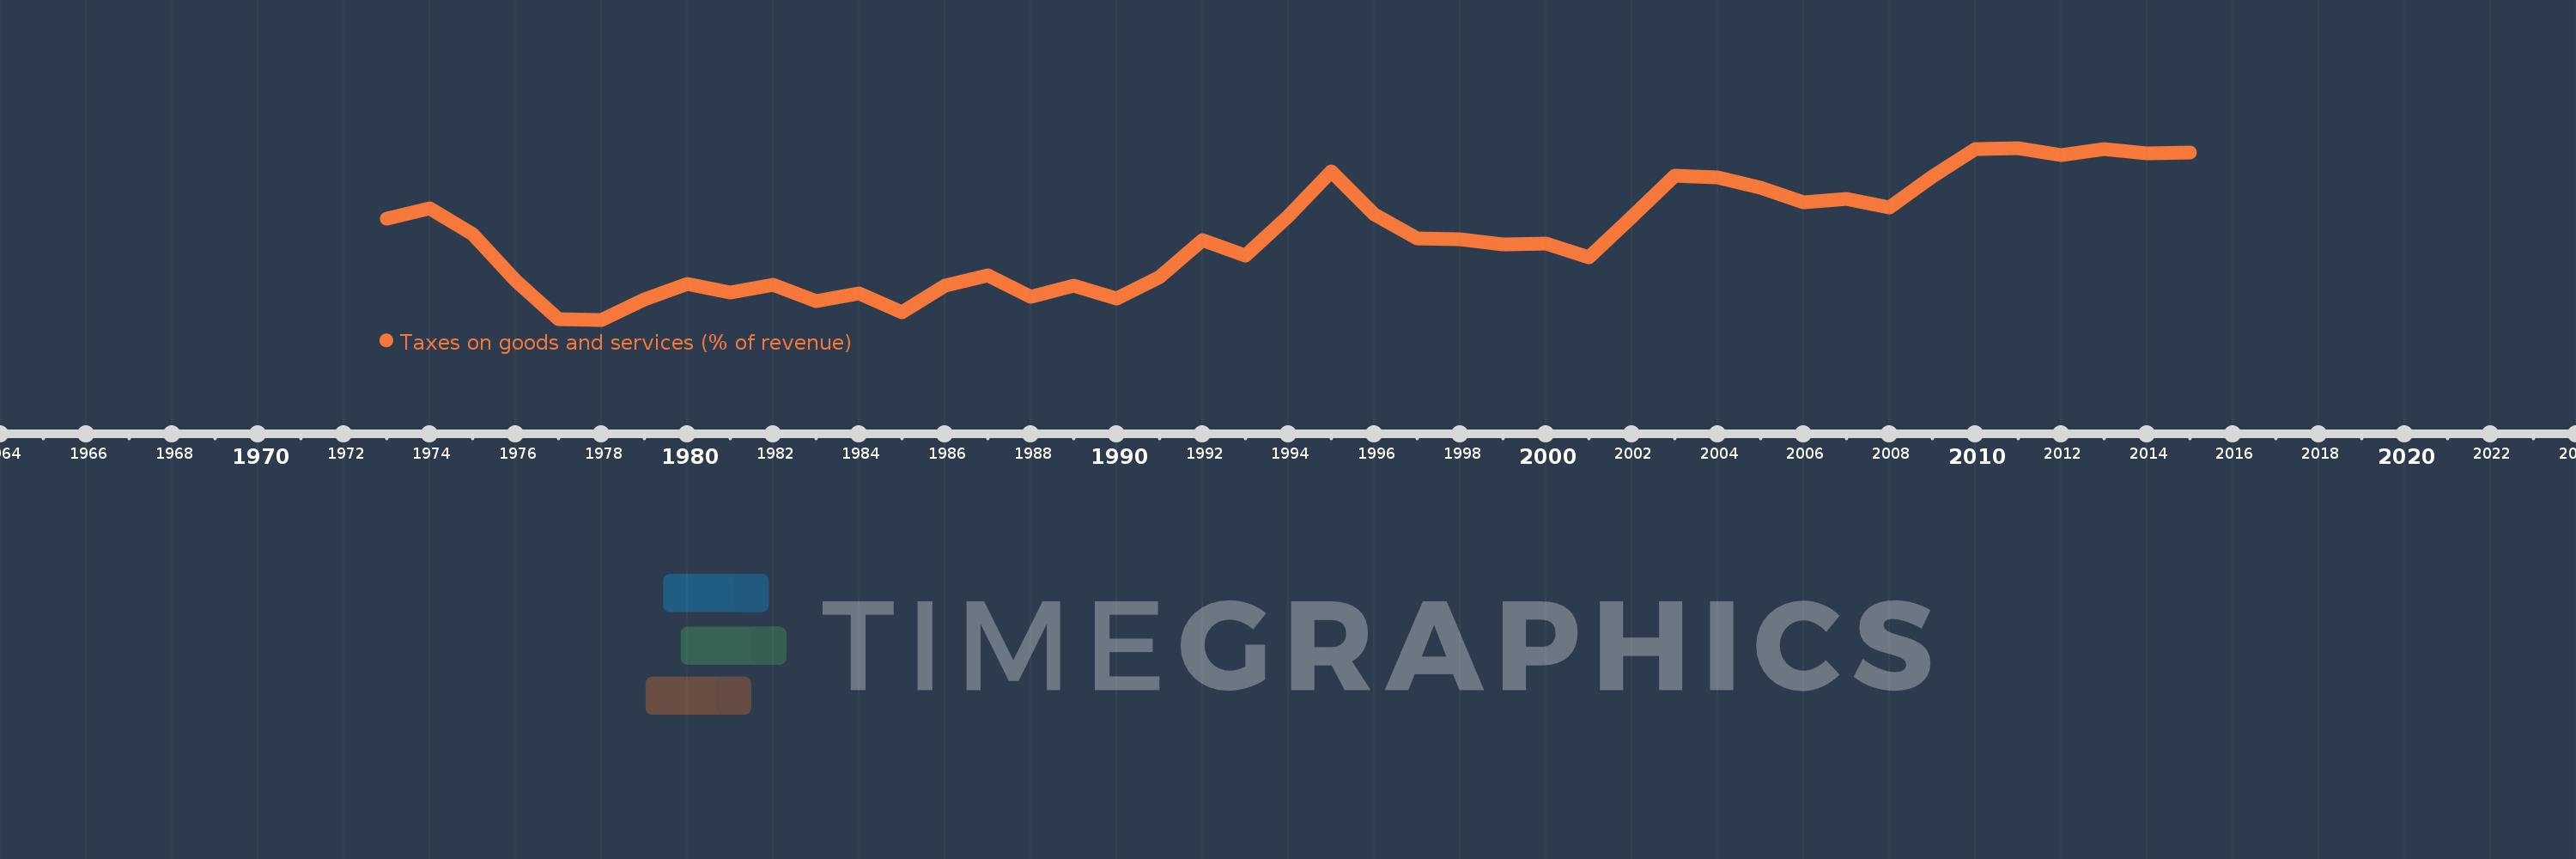
Taxes on goods and services (% of revenue)
2015,2014,2013,2012,2011,2010,2009,2008,2007,2006,2005,2004,2003,2002,2001,2000,1999,1998,1997,1996,1995,1994,1993,1992,1991,1990,1989,1988,1987,1986,1985,1984,1983,1982,1981,1980,1979,1978,1977,1976,1975,1974,1973
This statistics in other country:
AfghanistanAlbaniaAlgeriaAngolaAntigua and BarbudaArab WorldArgentinaArmeniaAustraliaAustriaAzerbaijanBahamas, TheBahrainBangladeshBarbadosBelarusBelgiumBelizeBeninBhutanBoliviaBosnia and HerzegovinaBotswanaBrazilBulgariaBurkina FasoBurundiCabo VerdeCambodiaCanadaCaribbean small statesCentral African RepublicCentral Europe and the BalticsChileChinaColombiaCongo, Dem. Rep.Congo, Rep.Costa RicaCote d'IvoireCroatiaCyprusCzech RepublicDenmarkDominicaDominican RepublicEarly-demographic dividendEast Asia & PacificEast Asia & Pacific (excluding high income)East Asia & Pacific (IDA & IBRD countries)Egypt, Arab Rep.El SalvadorEquatorial GuineaEstoniaEthiopiaEuro areaEurope & Central AsiaEurope & Central Asia (excluding high income)Europe & Central Asia (IDA & IBRD countries)European UnionFijiFinlandFranceGambia, TheGeorgiaGermanyGhanaGreeceGrenadaGuatemalaHeavily indebted poor countries (HIPC)High incomeHondurasHong Kong SAR, ChinaHungaryIBRD onlyIcelandIDA & IBRD totalIDA blendIDA onlyIDA totalIndiaIndonesiaIran, Islamic Rep.IraqIrelandIsraelItalyJamaicaJapanJordanKazakhstanKenyaKiribatiKorea, Rep.KuwaitKyrgyz RepublicLao PDRLate-demographic dividendLatin America & Caribbean Latin America & Caribbean (excluding high income)Latin America & the Caribbean (IDA & IBRD countries)LatviaLeast developed countries: UN classificationLebanonLesothoLiberiaLithuaniaLow & middle incomeLow incomeLower middle incomeLuxembourgMacao SAR, ChinaMacedonia, FYRMadagascarMalawiMalaysiaMaldivesMaliMaltaMauritiusMexicoMicronesia, Fed. Sts.Middle East & North AfricaMiddle East & North Africa (excluding high income)Middle East & North Africa (IDA & IBRD countries)Middle incomeMoldovaMongoliaMoroccoMozambiqueMyanmarNamibiaNepalNetherlandsNew ZealandNicaraguaNigeriaNorth AmericaNorwayOECD membersOmanOther small statesPakistanPanamaPapua New GuineaParaguayPeruPhilippinesPolandPortugalPost-demographic dividendPre-demographic dividendRomaniaRussian FederationRwandaSamoaSan MarinoSao Tome and PrincipeSenegalSerbiaSeychellesSierra LeoneSingaporeSlovak RepublicSloveniaSmall statesSolomon IslandsSouth AfricaSouth AsiaSouth Asia (IDA & IBRD)SpainSri LankaSt. Kitts and NevisSt. LuciaSub-Saharan Africa Sub-Saharan Africa (excluding high income)Sub-Saharan Africa (IDA & IBRD countries)SurinameSwazilandSwedenSwitzerlandSyrian Arab RepublicTajikistanTanzaniaThailandTimor-LesteTogoTrinidad and TobagoTunisiaTurkeyUgandaUkraineUnited Arab EmiratesUnited KingdomUnited StatesUpper middle incomeUruguayVanuatuVenezuela, RBVietnamWest Bank and GazaWorldYemen, Rep.ZambiaZimbabwe Timeline:
This timeline shows a graph from 1973 to 2015 of Sweden. No data until 1972. Number of actual observations by date: 43.
Source name:
World Development Indicators
Source organization:
International Monetary Fund, Government Finance Statistics Yearbook and data files.
Categories, topics:
Public Sector
Last updated:
apr 23, 2017
Indicators value changes by year
Minimum:
27.897
jan 1, 1978
Maximum:
38.845
jan 1, 2011
At the date of observation
Value
Absolute change
Change from previous value
jan 1, 1973
34.331
+34.331
0.0%
jan 1, 1974
35.007
+0.676
1.97%
jan 1, 1975
33.329
-1.678
-4.79%
jan 1, 1976
30.41
-2.919
-8.76%
jan 1, 1977
27.93
-2.48
-8.16%
jan 1, 1978
27.897
-0.033
-0.12%
jan 1, 1979
29.195
+1.298
4.65%
jan 1, 1980
30.186
+0.991
3.39%
jan 1, 1981
29.644
-0.542
-1.79%
jan 1, 1982
30.148
+0.504
1.7%
jan 1, 1983
29.085
-1.063
-3.52%
jan 1, 1984
29.59
+0.504
1.73%
jan 1, 1985
28.394
-1.195
-4.04%
jan 1, 1986
30.051
+1.657
5.83%
jan 1, 1987
30.753
+0.702
2.33%
jan 1, 1988
29.378
-1.375
-4.47%
jan 1, 1989
30.071
+0.693
2.36%
jan 1, 1990
29.264
-0.807
-2.69%
jan 1, 1991
30.6
+1.336
4.57%
jan 1, 1992
32.964
+2.364
7.73%
jan 1, 1993
31.961
-1.003
-3.04%
jan 1, 1994
34.499
+2.538
7.94%
jan 1, 1995
37.363
+2.864
8.3%
jan 1, 1996
34.632
-2.731
-7.31%
jan 1, 1997
33.104
-1.529
-4.41%
jan 1, 1998
33.036
-0.067
-0.2%
jan 1, 1999
32.707
-0.33
-1.0%
jan 1, 2000
32.75
+0.043
0.13%
jan 1, 2001
31.851
-0.899
-2.75%
jan 1, 2002
34.464
+2.614
8.21%
jan 1, 2003
37.062
+2.598
7.54%
jan 1, 2004
36.97
-0.092
-0.25%
jan 1, 2005
36.313
-0.657
-1.78%
jan 1, 2006
35.403
-0.91
-2.51%
jan 1, 2007
35.624
+0.22
0.62%
jan 1, 2008
35.05
-0.574
-1.61%
jan 1, 2009
37.004
+1.954
5.58%
jan 1, 2010
38.756
+1.752
4.73%
jan 1, 2011
38.845
+0.089
0.23%
jan 1, 2012
38.412
-0.432
-1.11%
jan 1, 2013
38.792
+0.38
0.99%
jan 1, 2014
38.496
-0.296
-0.76%
jan 1, 2015
38.537
+0.041
0.11%
Ranking of countries by current statistics by years


Comments: