29
/
en
AIzaSyAYiBZKx7MnpbEhh9jyipgxe19OcubqV5w
April 1, 2024
161045
Israel
ISR
true
2
1
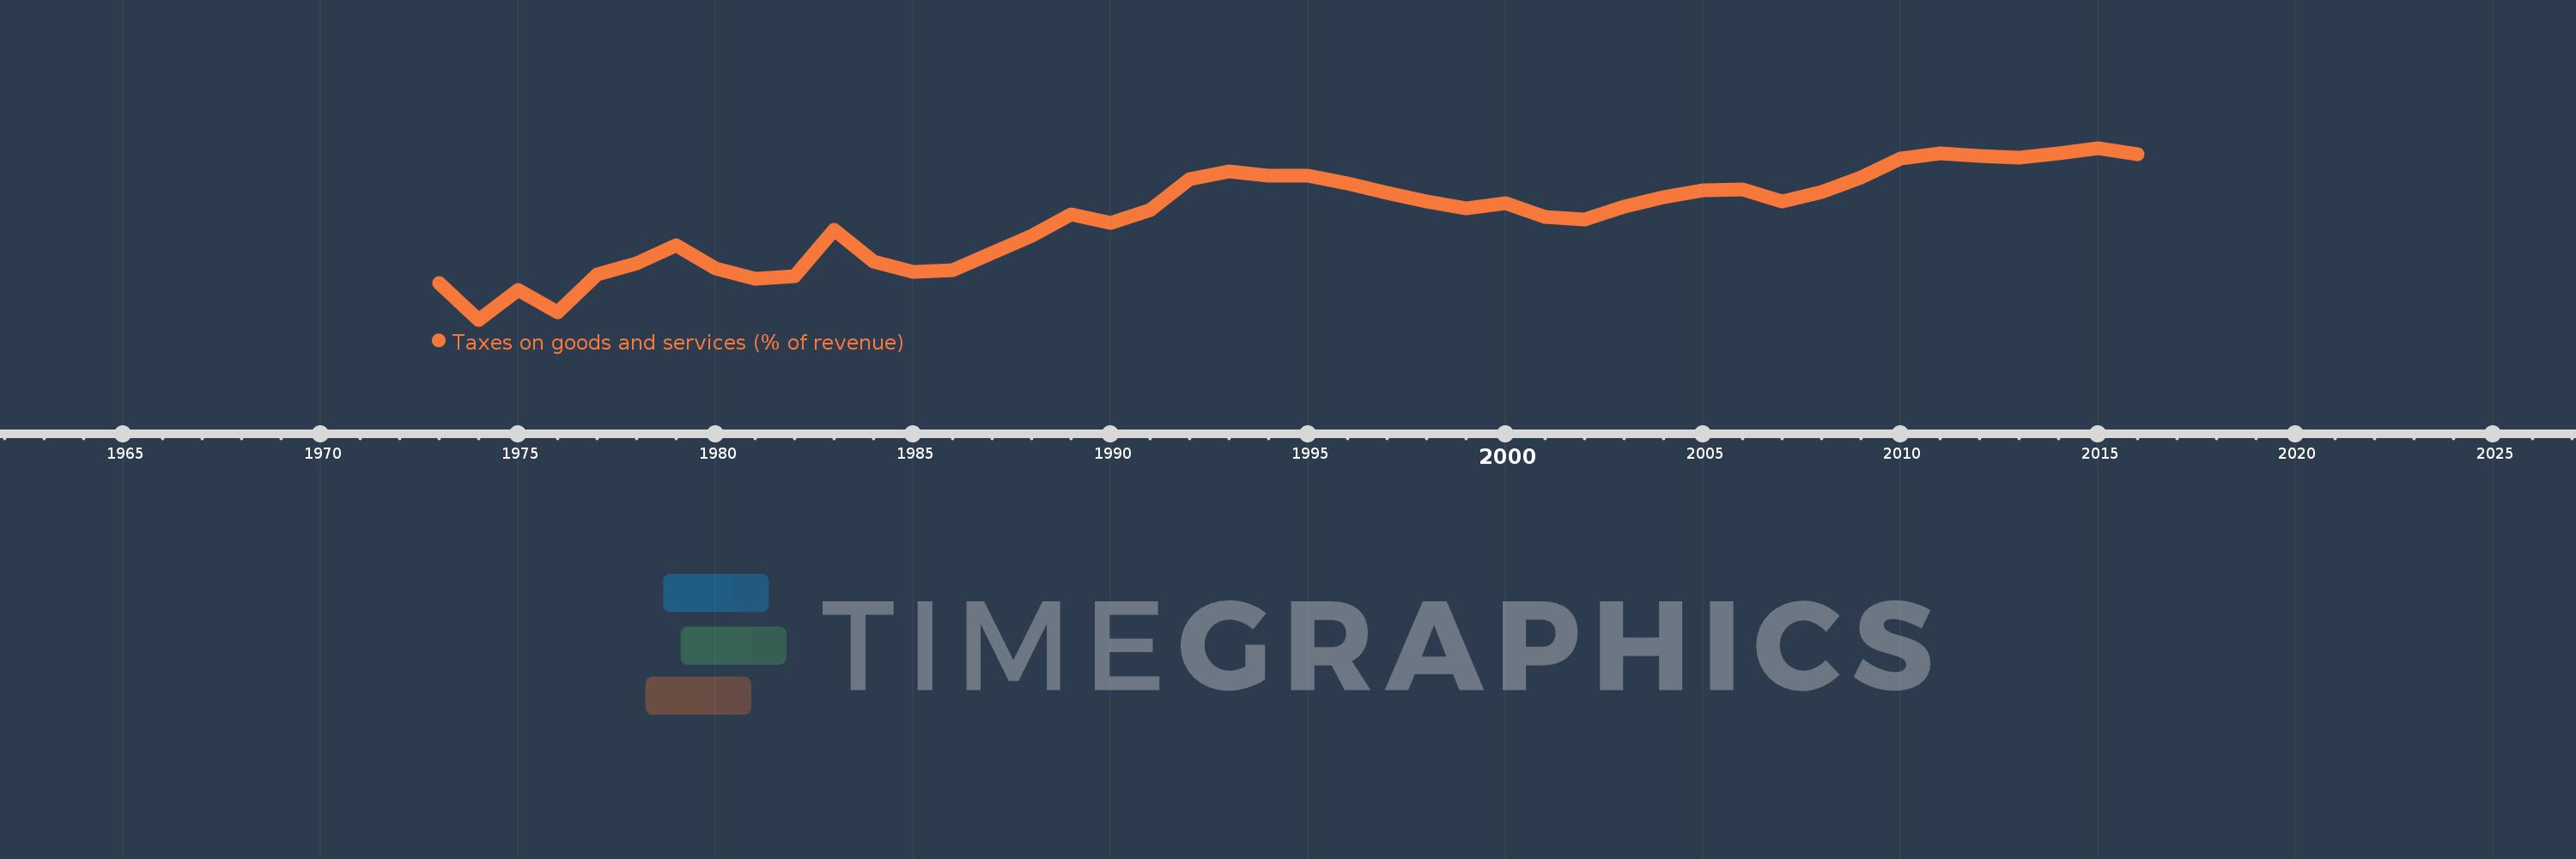
Taxes on goods and services (% of revenue)
2016,2015,2014,2013,2012,2011,2010,2009,2008,2007,2006,2005,2004,2003,2002,2001,2000,1999,1998,1997,1996,1995,1994,1993,1992,1991,1990,1989,1988,1987,1986,1985,1984,1983,1982,1981,1980,1979,1978,1977,1976,1975,1974,1973
This statistics in other country:
AfghanistanAlbaniaAlgeriaAngolaAntigua and BarbudaArab WorldArgentinaArmeniaAustraliaAustriaAzerbaijanBahamas, TheBahrainBangladeshBarbadosBelarusBelgiumBelizeBeninBhutanBoliviaBosnia and HerzegovinaBotswanaBrazilBulgariaBurkina FasoBurundiCabo VerdeCambodiaCanadaCaribbean small statesCentral African RepublicCentral Europe and the BalticsChileChinaColombiaCongo, Dem. Rep.Congo, Rep.Costa RicaCote d'IvoireCroatiaCyprusCzech RepublicDenmarkDominicaDominican RepublicEarly-demographic dividendEast Asia & PacificEast Asia & Pacific (excluding high income)East Asia & Pacific (IDA & IBRD countries)Egypt, Arab Rep.El SalvadorEquatorial GuineaEstoniaEthiopiaEuro areaEurope & Central AsiaEurope & Central Asia (excluding high income)Europe & Central Asia (IDA & IBRD countries)European UnionFijiFinlandFranceGambia, TheGeorgiaGermanyGhanaGreeceGrenadaGuatemalaHeavily indebted poor countries (HIPC)High incomeHondurasHong Kong SAR, ChinaHungaryIBRD onlyIcelandIDA & IBRD totalIDA blendIDA onlyIDA totalIndiaIndonesiaIran, Islamic Rep.IraqIrelandIsraelItalyJamaicaJapanJordanKazakhstanKenyaKiribatiKorea, Rep.KuwaitKyrgyz RepublicLao PDRLate-demographic dividendLatin America & Caribbean Latin America & Caribbean (excluding high income)Latin America & the Caribbean (IDA & IBRD countries)LatviaLeast developed countries: UN classificationLebanonLesothoLiberiaLithuaniaLow & middle incomeLow incomeLower middle incomeLuxembourgMacao SAR, ChinaMacedonia, FYRMadagascarMalawiMalaysiaMaldivesMaliMaltaMauritiusMexicoMicronesia, Fed. Sts.Middle East & North AfricaMiddle East & North Africa (excluding high income)Middle East & North Africa (IDA & IBRD countries)Middle incomeMoldovaMongoliaMoroccoMozambiqueMyanmarNamibiaNepalNetherlandsNew ZealandNicaraguaNigeriaNorth AmericaNorwayOECD membersOmanOther small statesPakistanPanamaPapua New GuineaParaguayPeruPhilippinesPolandPortugalPost-demographic dividendPre-demographic dividendRomaniaRussian FederationRwandaSamoaSan MarinoSao Tome and PrincipeSenegalSerbiaSeychellesSierra LeoneSingaporeSlovak RepublicSloveniaSmall statesSolomon IslandsSouth AfricaSouth AsiaSouth Asia (IDA & IBRD)SpainSri LankaSt. Kitts and NevisSt. LuciaSub-Saharan Africa Sub-Saharan Africa (excluding high income)Sub-Saharan Africa (IDA & IBRD countries)SurinameSwazilandSwedenSwitzerlandSyrian Arab RepublicTajikistanTanzaniaThailandTimor-LesteTogoTrinidad and TobagoTunisiaTurkeyUgandaUkraineUnited Arab EmiratesUnited KingdomUnited StatesUpper middle incomeUruguayVanuatuVenezuela, RBVietnamWest Bank and GazaWorldYemen, Rep.ZambiaZimbabwe Timeline:
This timeline shows a graph from 1973 to 2016 of Israel. No data until 1972. Number of actual observations by date: 44.
Source name:
World Development Indicators
Source organization:
International Monetary Fund, Government Finance Statistics Yearbook and data files.
Categories, topics:
Public Sector
Last updated:
apr 23, 2017
Indicators value changes by year
Minimum:
15.789
jan 1, 1974
Maximum:
35.474
jan 1, 2015
At the date of observation
Value
Absolute change
Change from previous value
jan 1, 1973
20.0
+20.0
0.0%
jan 1, 1974
15.789
-4.211
-21.05%
jan 1, 1975
19.231
+3.441
21.79%
jan 1, 1976
16.667
-2.564
-13.33%
jan 1, 1977
20.968
+4.301
25.81%
jan 1, 1978
22.222
+1.254
5.98%
jan 1, 1979
24.306
+2.083
9.38%
jan 1, 1980
21.639
-2.666
-10.97%
jan 1, 1981
20.516
-1.123
-5.19%
jan 1, 1982
20.759
+0.243
1.18%
jan 1, 1983
26.114
+5.355
25.79%
jan 1, 1984
22.458
-3.656
-14.0%
jan 1, 1985
21.283
-1.175
-5.23%
jan 1, 1986
21.492
+0.209
0.98%
jan 1, 1987
23.444
+1.951
9.08%
jan 1, 1988
25.44
+1.997
8.52%
jan 1, 1989
27.851
+2.41
9.47%
jan 1, 1990
26.883
-0.967
-3.47%
jan 1, 1991
28.348
+1.465
5.45%
jan 1, 1992
31.866
+3.517
12.41%
jan 1, 1993
32.821
+0.955
3.0%
jan 1, 1994
32.336
-0.485
-1.48%
jan 1, 1995
32.25
-0.086
-0.26%
jan 1, 1996
31.402
-0.848
-2.63%
jan 1, 1997
30.364
-1.038
-3.3%
jan 1, 1998
29.365
-0.999
-3.29%
jan 1, 1999
28.572
-0.793
-2.7%
jan 1, 2000
29.191
+0.619
2.16%
jan 1, 2001
27.543
-1.648
-5.65%
jan 1, 2002
27.241
-0.302
-1.1%
jan 1, 2003
28.796
+1.555
5.71%
jan 1, 2004
29.803
+1.007
3.5%
jan 1, 2005
30.657
+0.855
2.87%
jan 1, 2006
30.702
+0.044
0.14%
jan 1, 2007
29.348
-1.353
-4.41%
jan 1, 2008
30.467
+1.119
3.81%
jan 1, 2009
32.073
+1.606
5.27%
jan 1, 2010
34.27
+2.197
6.85%
jan 1, 2011
34.902
+0.632
1.84%
jan 1, 2012
34.604
-0.298
-0.85%
jan 1, 2013
34.321
-0.283
-0.82%
jan 1, 2014
34.856
+0.536
1.56%
jan 1, 2015
35.474
+0.618
1.77%
jan 1, 2016
34.752
-0.722
-2.04%
Ranking of countries by current statistics by years


Comments: