29
/
en
AIzaSyAYiBZKx7MnpbEhh9jyipgxe19OcubqV5w
April 1, 2024
117468
Cyprus
CYP
true
2
1
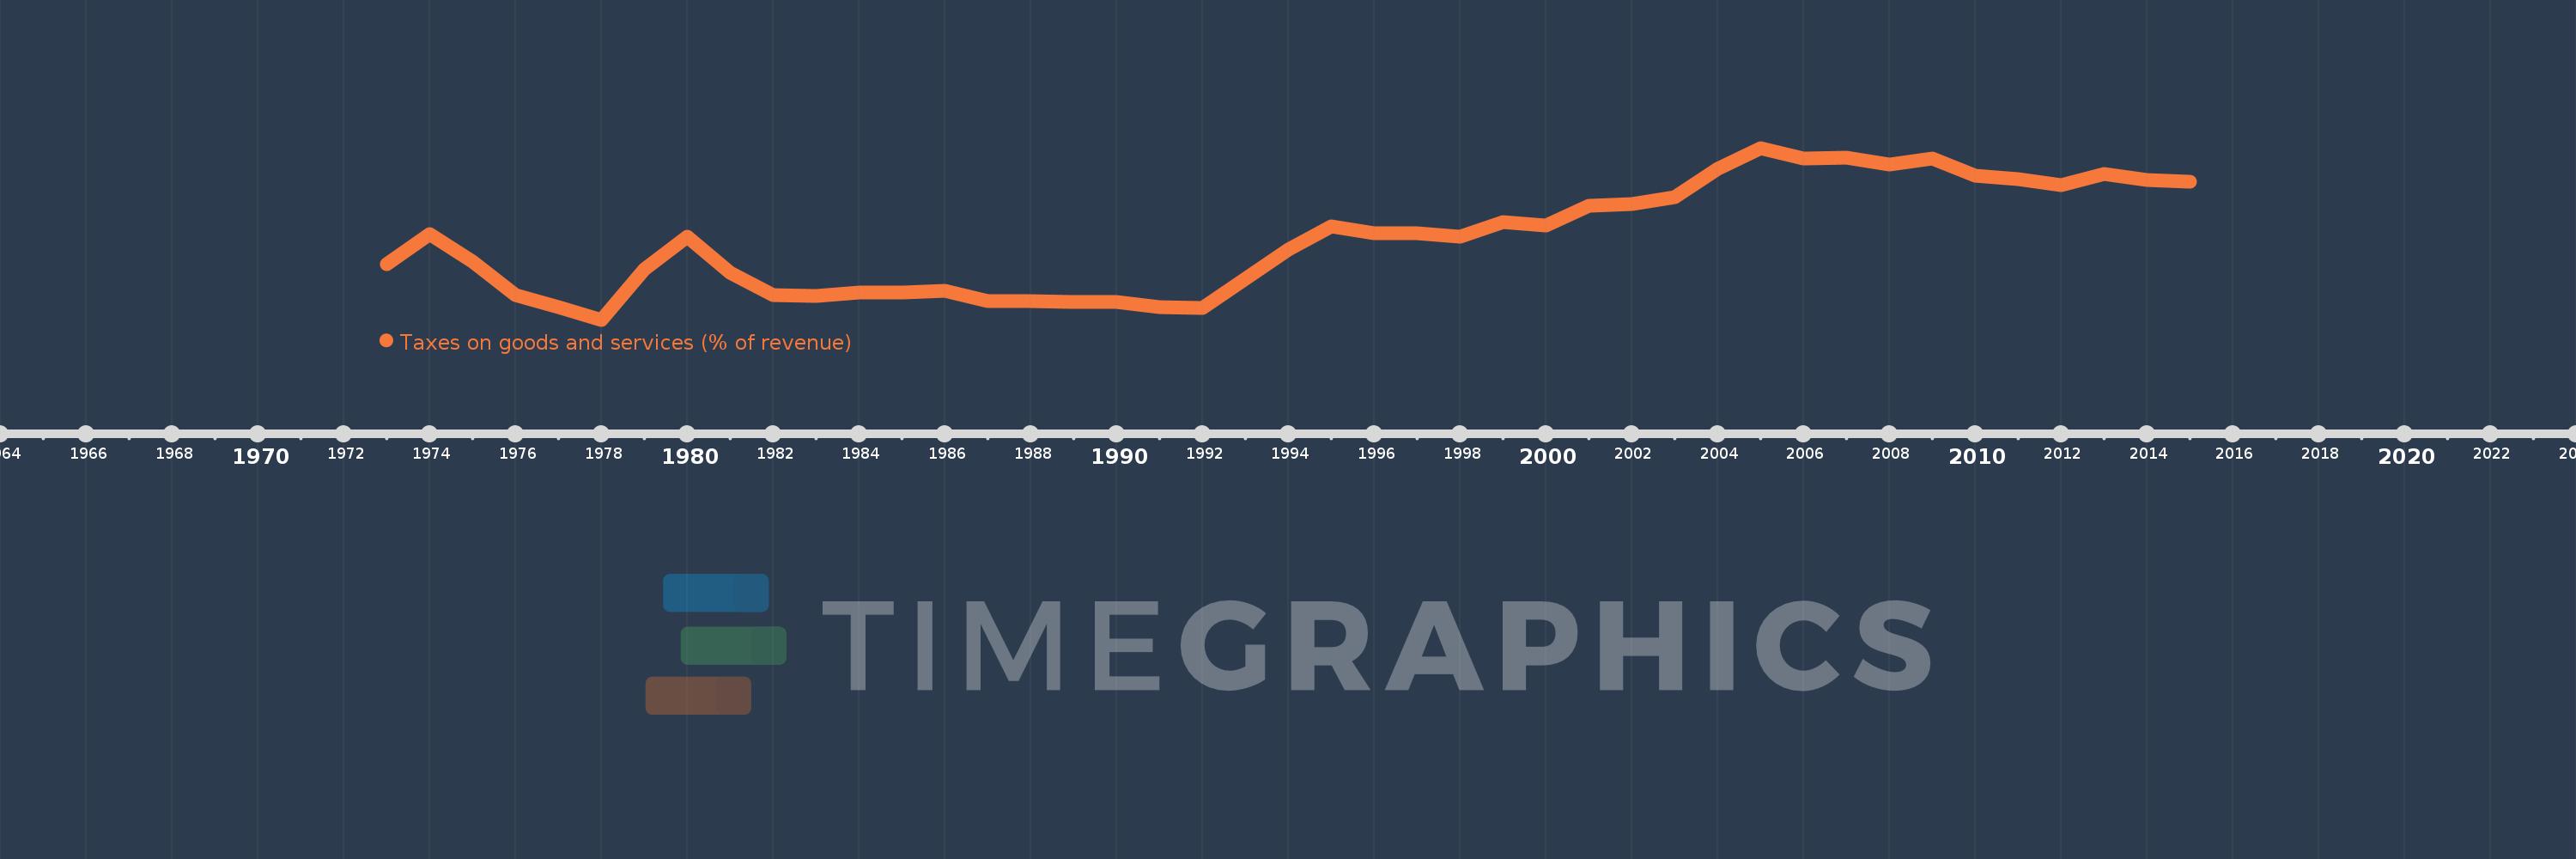
Taxes on goods and services (% of revenue)
2015,2014,2013,2012,2011,2010,2009,2008,2007,2006,2005,2004,2003,2002,2001,2000,1999,1998,1997,1996,1995,1994,1993,1992,1991,1990,1989,1988,1987,1986,1985,1984,1983,1982,1981,1980,1979,1978,1977,1976,1975,1974,1973
This statistics in other country:
AfghanistanAlbaniaAlgeriaAngolaAntigua and BarbudaArab WorldArgentinaArmeniaAustraliaAustriaAzerbaijanBahamas, TheBahrainBangladeshBarbadosBelarusBelgiumBelizeBeninBhutanBoliviaBosnia and HerzegovinaBotswanaBrazilBulgariaBurkina FasoBurundiCabo VerdeCambodiaCanadaCaribbean small statesCentral African RepublicCentral Europe and the BalticsChileChinaColombiaCongo, Dem. Rep.Congo, Rep.Costa RicaCote d'IvoireCroatiaCyprusCzech RepublicDenmarkDominicaDominican RepublicEarly-demographic dividendEast Asia & PacificEast Asia & Pacific (excluding high income)East Asia & Pacific (IDA & IBRD countries)Egypt, Arab Rep.El SalvadorEquatorial GuineaEstoniaEthiopiaEuro areaEurope & Central AsiaEurope & Central Asia (excluding high income)Europe & Central Asia (IDA & IBRD countries)European UnionFijiFinlandFranceGambia, TheGeorgiaGermanyGhanaGreeceGrenadaGuatemalaHeavily indebted poor countries (HIPC)High incomeHondurasHong Kong SAR, ChinaHungaryIBRD onlyIcelandIDA & IBRD totalIDA blendIDA onlyIDA totalIndiaIndonesiaIran, Islamic Rep.IraqIrelandIsraelItalyJamaicaJapanJordanKazakhstanKenyaKiribatiKorea, Rep.KuwaitKyrgyz RepublicLao PDRLate-demographic dividendLatin America & Caribbean Latin America & Caribbean (excluding high income)Latin America & the Caribbean (IDA & IBRD countries)LatviaLeast developed countries: UN classificationLebanonLesothoLiberiaLithuaniaLow & middle incomeLow incomeLower middle incomeLuxembourgMacao SAR, ChinaMacedonia, FYRMadagascarMalawiMalaysiaMaldivesMaliMaltaMauritiusMexicoMicronesia, Fed. Sts.Middle East & North AfricaMiddle East & North Africa (excluding high income)Middle East & North Africa (IDA & IBRD countries)Middle incomeMoldovaMongoliaMoroccoMozambiqueMyanmarNamibiaNepalNetherlandsNew ZealandNicaraguaNigeriaNorth AmericaNorwayOECD membersOmanOther small statesPakistanPanamaPapua New GuineaParaguayPeruPhilippinesPolandPortugalPost-demographic dividendPre-demographic dividendRomaniaRussian FederationRwandaSamoaSan MarinoSao Tome and PrincipeSenegalSerbiaSeychellesSierra LeoneSingaporeSlovak RepublicSloveniaSmall statesSolomon IslandsSouth AfricaSouth AsiaSouth Asia (IDA & IBRD)SpainSri LankaSt. Kitts and NevisSt. LuciaSub-Saharan Africa Sub-Saharan Africa (excluding high income)Sub-Saharan Africa (IDA & IBRD countries)SurinameSwazilandSwedenSwitzerlandSyrian Arab RepublicTajikistanTanzaniaThailandTimor-LesteTogoTrinidad and TobagoTunisiaTurkeyUgandaUkraineUnited Arab EmiratesUnited KingdomUnited StatesUpper middle incomeUruguayVanuatuVenezuela, RBVietnamWest Bank and GazaWorldYemen, Rep.ZambiaZimbabwe Timeline:
This timeline shows a graph from 1973 to 2015 of Cyprus. No data until 1972. Number of actual observations by date: 43.
Source name:
World Development Indicators
Source organization:
International Monetary Fund, Government Finance Statistics Yearbook and data files.
Categories, topics:
Public Sector
Last updated:
apr 23, 2017
Indicators value changes by year
Minimum:
16.651
jan 1, 1978
Maximum:
38.963
jan 1, 2005
At the date of observation
Value
Absolute change
Change from previous value
jan 1, 1973
23.878
+23.878
0.0%
jan 1, 1974
27.723
+3.846
16.11%
jan 1, 1975
24.166
-3.558
-12.83%
jan 1, 1976
19.859
-4.306
-17.82%
jan 1, 1977
18.297
-1.562
-7.87%
jan 1, 1978
16.651
-1.646
-9.0%
jan 1, 1979
23.246
+6.595
39.61%
jan 1, 1980
27.486
+4.24
18.24%
jan 1, 1981
22.807
-4.679
-17.02%
jan 1, 1982
19.875
-2.932
-12.86%
jan 1, 1983
19.703
-0.172
-0.86%
jan 1, 1984
20.159
+0.455
2.31%
jan 1, 1985
20.176
+0.017
0.09%
jan 1, 1986
20.42
+0.244
1.21%
jan 1, 1987
19.057
-1.363
-6.67%
jan 1, 1988
19.067
+0.01
0.05%
jan 1, 1989
18.938
-0.129
-0.68%
jan 1, 1990
19.011
+0.073
0.39%
jan 1, 1991
18.263
-0.747
-3.93%
jan 1, 1992
18.188
-0.075
-0.41%
jan 1, 1993
21.972
+3.784
20.8%
jan 1, 1994
25.774
+3.803
17.31%
jan 1, 1995
28.821
+3.047
11.82%
jan 1, 1996
27.854
-0.967
-3.36%
jan 1, 1997
27.926
+0.072
0.26%
jan 1, 1998
27.399
-0.527
-1.89%
jan 1, 1999
29.384
+1.985
7.25%
jan 1, 2000
28.938
-0.446
-1.52%
jan 1, 2001
31.425
+2.487
8.59%
jan 1, 2002
31.716
+0.291
0.92%
jan 1, 2003
32.596
+0.88
2.77%
jan 1, 2004
36.274
+3.679
11.29%
jan 1, 2005
38.963
+2.689
7.41%
jan 1, 2006
37.613
-1.35
-3.46%
jan 1, 2007
37.655
+0.042
0.11%
jan 1, 2008
36.77
-0.885
-2.35%
jan 1, 2009
37.605
+0.835
2.27%
jan 1, 2010
35.402
-2.203
-5.86%
jan 1, 2011
34.927
-0.475
-1.34%
jan 1, 2012
34.096
-0.831
-2.38%
jan 1, 2013
35.529
+1.432
4.2%
jan 1, 2014
34.754
-0.775
-2.18%
jan 1, 2015
34.614
-0.14
-0.4%
Ranking of countries by current statistics by years


Comments: