29
/
en
AIzaSyAYiBZKx7MnpbEhh9jyipgxe19OcubqV5w
April 1, 2024
284253
Yemen, Rep.
YEM
true
2
1
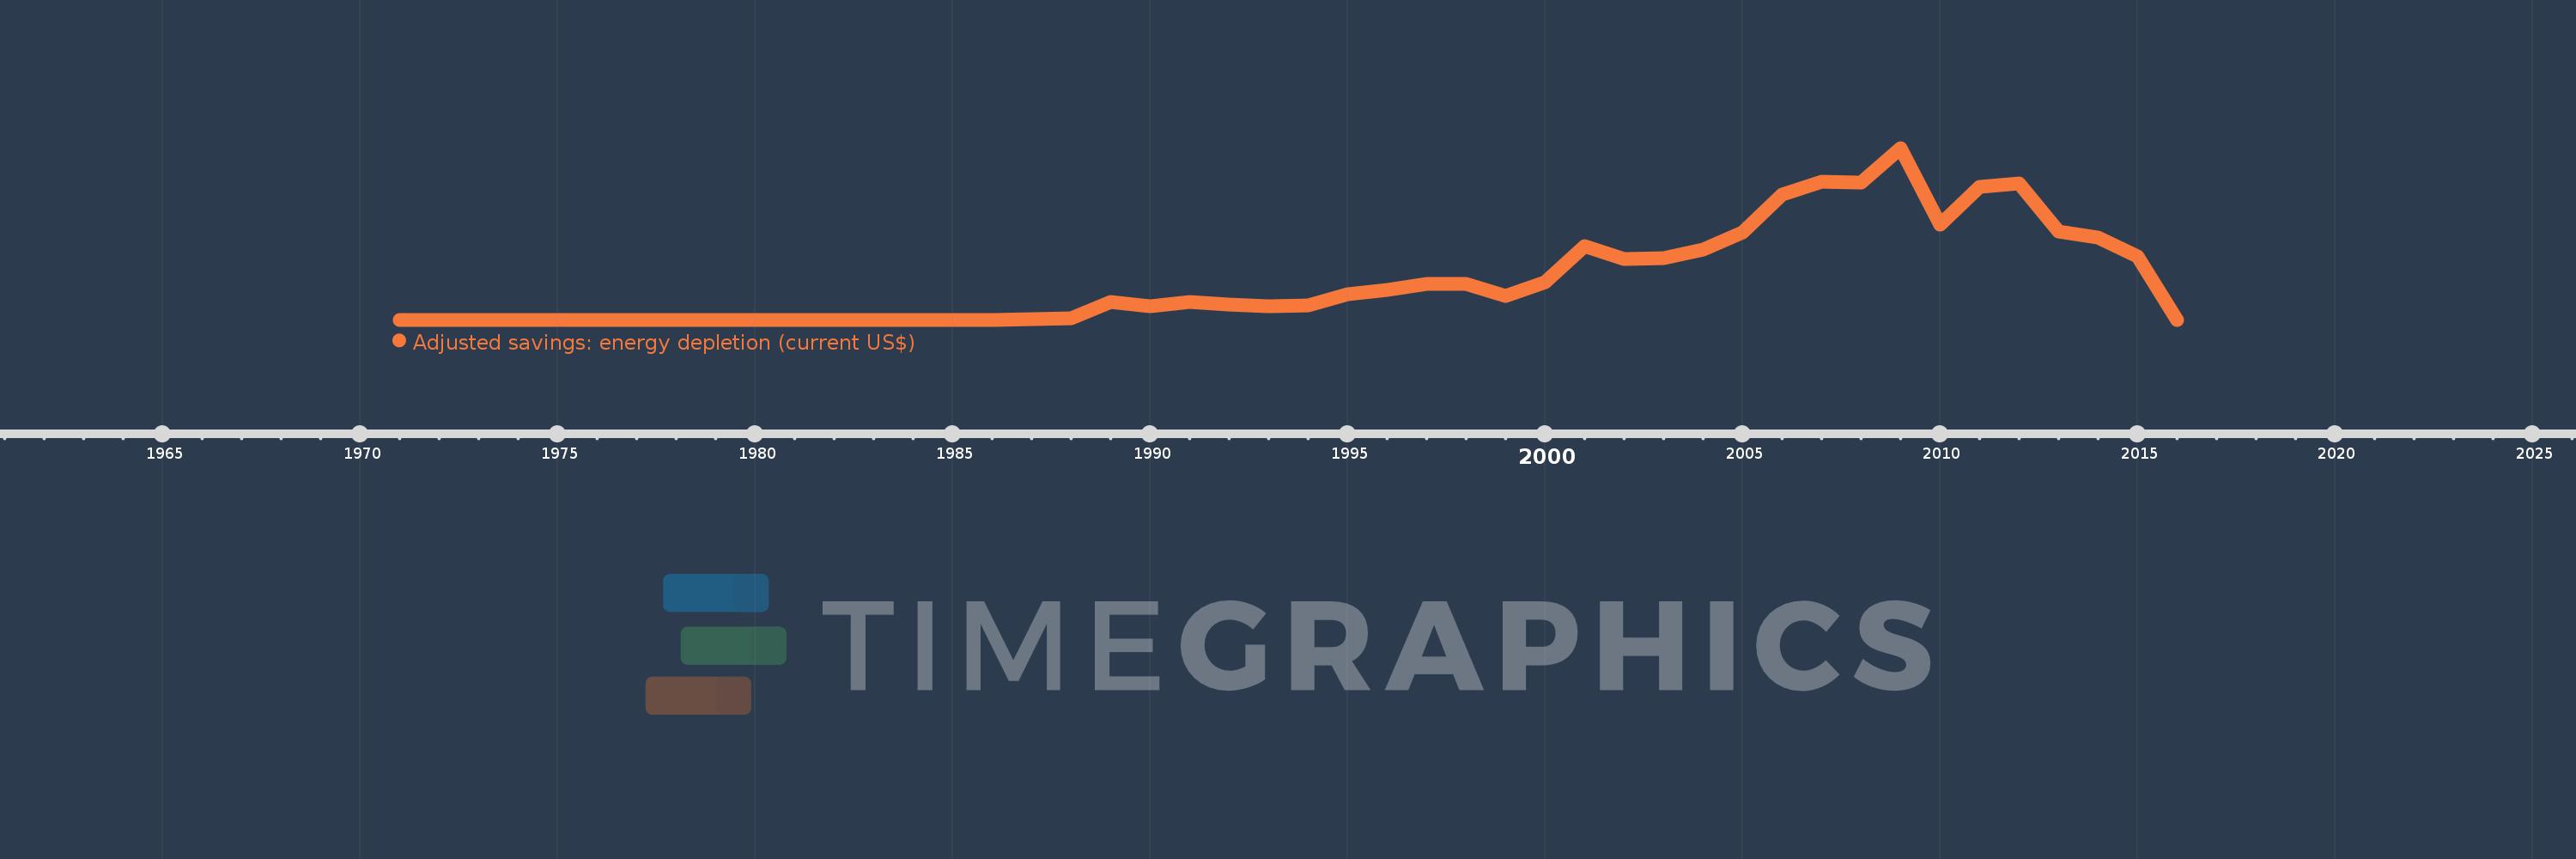
Adjusted savings: energy depletion (current US$)
2016,2015,2014,2013,2012,2011,2010,2009,2008,2007,2006,2005,2004,2003,2002,2001,2000,1999,1998,1997,1996,1995,1994,1993,1992,1991,1990,1989,1988,1987,1986,1985,1984,1983,1982,1981,1980,1979,1978,1977,1976,1975,1974,1973,1972,1971
This statistics in other country:
AfghanistanAlbaniaAlgeriaAmerican SamoaAndorraAngolaAntigua and BarbudaArgentinaArmeniaArubaAustraliaAustriaAzerbaijanBahamas, TheBahrainBangladeshBarbadosBelarusBelgiumBelizeBeninBermudaBhutanBoliviaBosnia and HerzegovinaBotswanaBrazilBrunei DarussalamBulgariaBurkina FasoBurundiCabo VerdeCambodiaCameroonCanadaCayman IslandsCentral African RepublicChadChannel IslandsChileChinaColombiaComorosCongo, Dem. Rep.Congo, Rep.Costa RicaCote d'IvoireCroatiaCubaCuracaoCyprusCzech RepublicDenmarkDjiboutiDominicaDominican RepublicEcuadorEgypt, Arab Rep.El SalvadorEquatorial GuineaEritreaEstoniaEthiopiaFaroe IslandsFijiFinlandFranceFrench PolynesiaGabonGambia, TheGeorgiaGermanyGhanaGibraltarGreeceGreenlandGrenadaGuamGuatemalaGuineaGuinea-BissauGuyanaHaitiHondurasHong Kong SAR, ChinaHungaryIcelandIndiaIndonesiaIran, Islamic Rep.IraqIrelandIsle of ManIsraelItalyJamaicaJapanJordanKazakhstanKenyaKiribatiKorea, Dem. People’s Rep.Korea, Rep.KosovoKuwaitKyrgyz RepublicLao PDRLatviaLebanonLesothoLiberiaLibyaLiechtensteinLithuaniaLuxembourgMacao SAR, ChinaMacedonia, FYRMadagascarMalawiMalaysiaMaldivesMaliMaltaMarshall IslandsMauritaniaMauritiusMexicoMicronesia, Fed. Sts.MoldovaMonacoMongoliaMontenegroMoroccoMozambiqueMyanmarNamibiaNepalNetherlandsNew CaledoniaNew ZealandNicaraguaNigerNigeriaNorthern Mariana IslandsNorwayOmanPakistanPalauPanamaPapua New GuineaParaguayPeruPhilippinesPolandPortugalPuerto RicoQatarRomaniaRussian FederationRwandaSamoaSan MarinoSao Tome and PrincipeSaudi ArabiaSenegalSerbiaSeychellesSierra LeoneSingaporeSint Maarten (Dutch part)Slovak RepublicSloveniaSolomon IslandsSomaliaSouth AfricaSouth SudanSpainSri LankaSt. Kitts and NevisSt. LuciaSt. Martin (French part)St. Vincent and the GrenadinesSudanSurinameSwazilandSwedenSwitzerlandSyrian Arab RepublicTajikistanTanzaniaThailandTimor-LesteTogoTongaTrinidad and TobagoTunisiaTurkeyTurkmenistanTurks and Caicos IslandsTuvaluUgandaUkraineUnited Arab EmiratesUnited KingdomUnited StatesUruguayUzbekistanVanuatuVenezuela, RBVietnamVirgin Islands (U.S.)West Bank and GazaYemen, Rep.ZambiaZimbabwe Timeline:
This timeline shows a graph from 1971 to 2016 of Yemen, Rep.. No data until 1970. Number of actual observations by date: 46.
Source name:
World Development Indicators
Source organization:
World Bank staff estimates based on sources and methods in World Bank's "The Changing Wealth of Nations: Measuring Sustainable Development in the New Millennium" (2011).
Categories, topics:
Economy & Growth, Energy & Mining, Environment
Last updated:
apr 23, 2017
Indicators value changes by year
Maximum:
5.865 bln
jan 1, 2009
At the date of observation
Value
Absolute change
Change from previous value
jan 1, 1987
17.521 mln
+17.521 mln
%
jan 1, 1988
48.419 mln
+30.898 mln
176.35%
jan 1, 1989
615.792 mln
+567.373 mln
1.17K%
jan 1, 1990
455.675 mln
-160.117 mln
-26.0%
jan 1, 1991
616.302 mln
+160.627 mln
35.25%
jan 1, 1992
512.739 mln
-103.563 mln
-16.8%
jan 1, 1993
460.093 mln
-52.647 mln
-10.27%
jan 1, 1994
483.919 mln
+23.826 mln
5.18%
jan 1, 1995
883.56 mln
+399.642 mln
82.58%
jan 1, 1996
1.014 bln
+130.879 mln
14.81%
jan 1, 1997
1.215 bln
+200.741 mln
19.79%
jan 1, 1998
1.234 bln
+19.037 mln
1.57%
jan 1, 1999
808.151 mln
-426.066 mln
-34.52%
jan 1, 2000
1.281 bln
+473.216 mln
58.56%
jan 1, 2001
2.499 bln
+1.218 bln
95.06%
jan 1, 2002
2.069 bln
-430.213 mln
-17.21%
jan 1, 2003
2.105 bln
+35.88 mln
1.73%
jan 1, 2004
2.407 bln
+301.509 mln
14.32%
jan 1, 2005
2.98 bln
+573.21 mln
23.82%
jan 1, 2006
4.28 bln
+1.301 bln
43.64%
jan 1, 2007
4.702 bln
+421.623 mln
9.85%
jan 1, 2008
4.695 bln
-7.337 mln
-0.16%
jan 1, 2009
5.865 bln
+1.17 bln
24.92%
jan 1, 2010
3.258 bln
-2.606 bln
-44.44%
jan 1, 2011
4.526 bln
+1.268 bln
38.92%
jan 1, 2012
4.639 bln
+113.075 mln
2.5%
jan 1, 2013
3.023 bln
-1.617 bln
-34.84%
jan 1, 2014
2.798 bln
-224.56 mln
-7.43%
jan 1, 2015
2.171 bln
-626.648 mln
-22.4%
jan 1, 2016
0.0
-2.171 bln
-100.0%
Ranking of countries by current statistics by years


Comments: