29
/
en
AIzaSyAYiBZKx7MnpbEhh9jyipgxe19OcubqV5w
April 1, 2024
179720
Libya
LBY
true
2
1
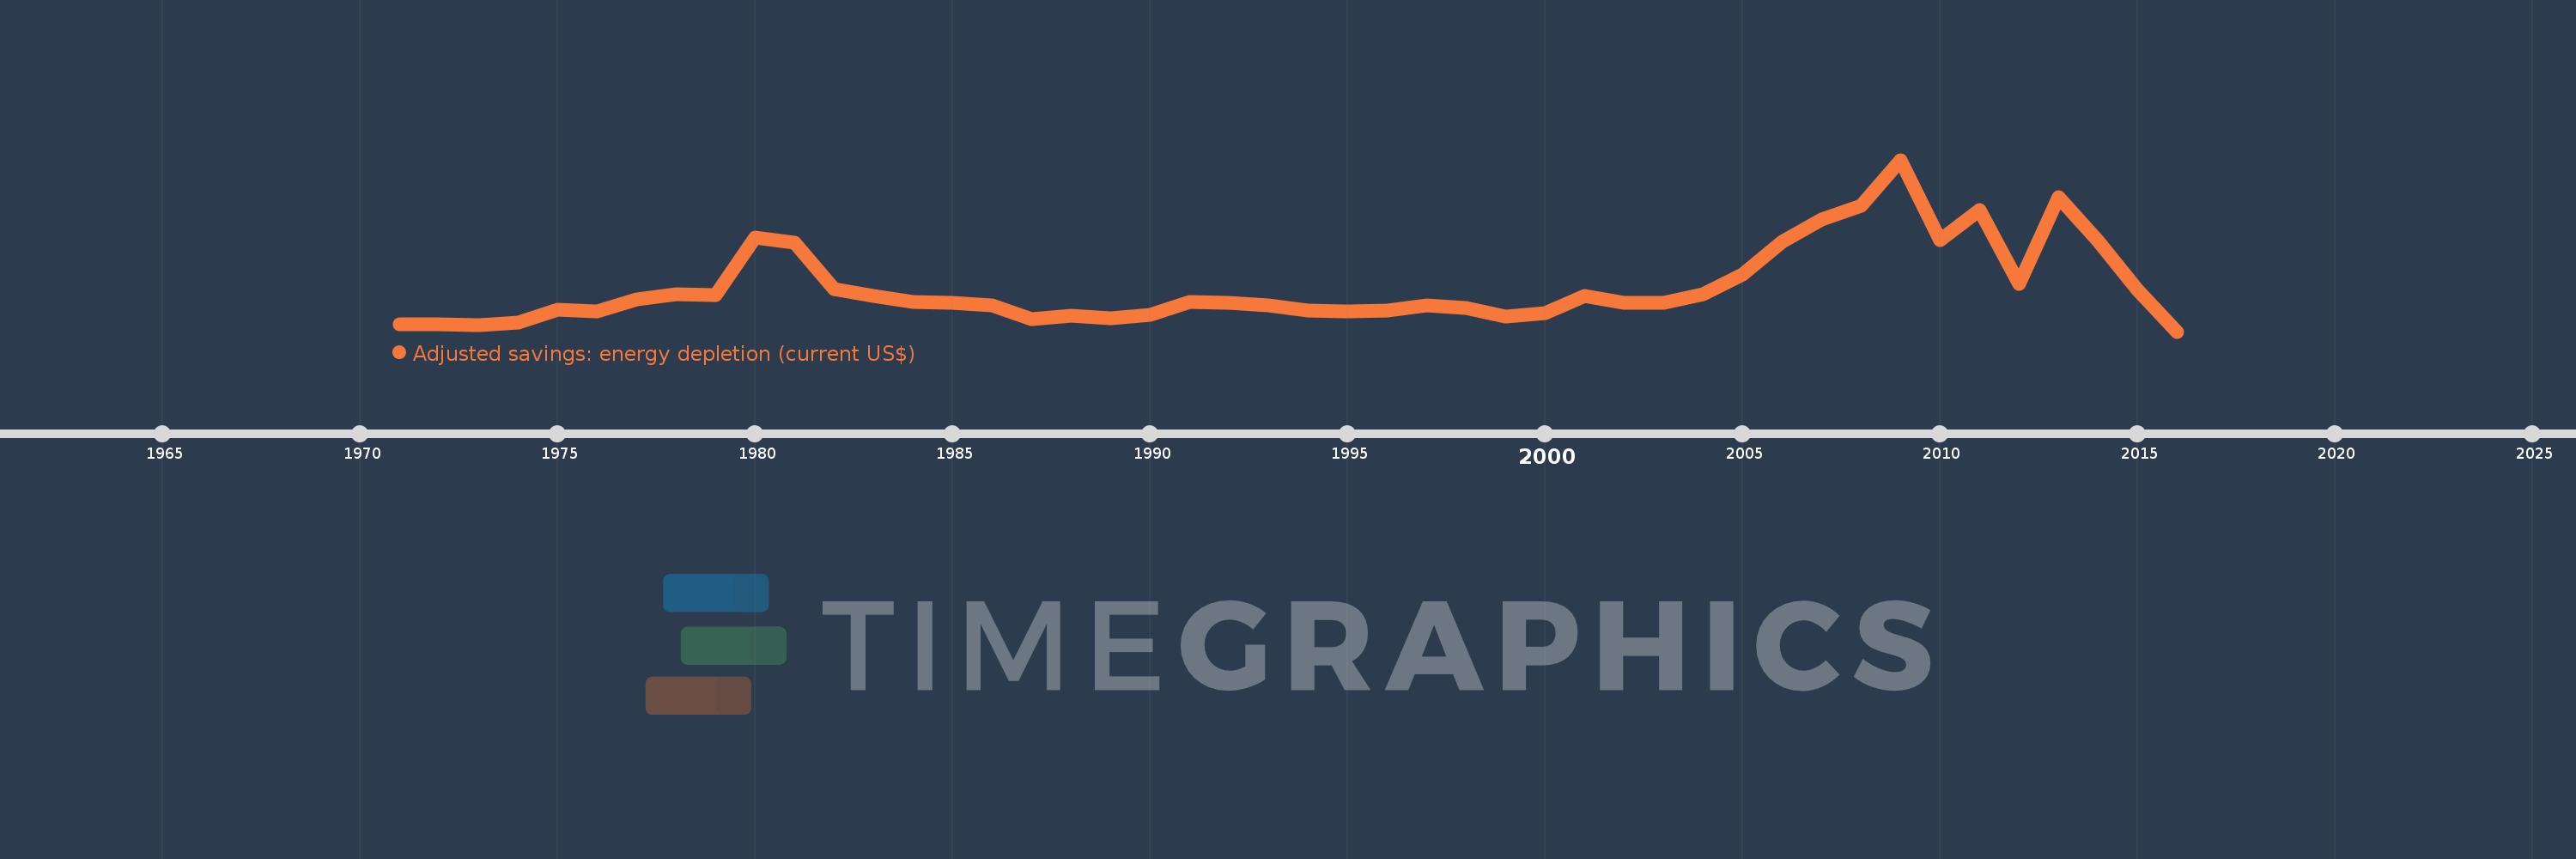
Adjusted savings: energy depletion (current US$)
2016,2015,2014,2013,2012,2011,2010,2009,2008,2007,2006,2005,2004,2003,2002,2001,2000,1999,1998,1997,1996,1995,1994,1993,1992,1991,1990,1989,1988,1987,1986,1985,1984,1983,1982,1981,1980,1979,1978,1977,1976,1975,1974,1973,1972,1971
This statistics in other country:
AfghanistanAlbaniaAlgeriaAmerican SamoaAndorraAngolaAntigua and BarbudaArgentinaArmeniaArubaAustraliaAustriaAzerbaijanBahamas, TheBahrainBangladeshBarbadosBelarusBelgiumBelizeBeninBermudaBhutanBoliviaBosnia and HerzegovinaBotswanaBrazilBrunei DarussalamBulgariaBurkina FasoBurundiCabo VerdeCambodiaCameroonCanadaCayman IslandsCentral African RepublicChadChannel IslandsChileChinaColombiaComorosCongo, Dem. Rep.Congo, Rep.Costa RicaCote d'IvoireCroatiaCubaCuracaoCyprusCzech RepublicDenmarkDjiboutiDominicaDominican RepublicEcuadorEgypt, Arab Rep.El SalvadorEquatorial GuineaEritreaEstoniaEthiopiaFaroe IslandsFijiFinlandFranceFrench PolynesiaGabonGambia, TheGeorgiaGermanyGhanaGibraltarGreeceGreenlandGrenadaGuamGuatemalaGuineaGuinea-BissauGuyanaHaitiHondurasHong Kong SAR, ChinaHungaryIcelandIndiaIndonesiaIran, Islamic Rep.IraqIrelandIsle of ManIsraelItalyJamaicaJapanJordanKazakhstanKenyaKiribatiKorea, Dem. People’s Rep.Korea, Rep.KosovoKuwaitKyrgyz RepublicLao PDRLatviaLebanonLesothoLiberiaLibyaLiechtensteinLithuaniaLuxembourgMacao SAR, ChinaMacedonia, FYRMadagascarMalawiMalaysiaMaldivesMaliMaltaMarshall IslandsMauritaniaMauritiusMexicoMicronesia, Fed. Sts.MoldovaMonacoMongoliaMontenegroMoroccoMozambiqueMyanmarNamibiaNepalNetherlandsNew CaledoniaNew ZealandNicaraguaNigerNigeriaNorthern Mariana IslandsNorwayOmanPakistanPalauPanamaPapua New GuineaParaguayPeruPhilippinesPolandPortugalPuerto RicoQatarRomaniaRussian FederationRwandaSamoaSan MarinoSao Tome and PrincipeSaudi ArabiaSenegalSerbiaSeychellesSierra LeoneSingaporeSint Maarten (Dutch part)Slovak RepublicSloveniaSolomon IslandsSomaliaSouth AfricaSouth SudanSpainSri LankaSt. Kitts and NevisSt. LuciaSt. Martin (French part)St. Vincent and the GrenadinesSudanSurinameSwazilandSwedenSwitzerlandSyrian Arab RepublicTajikistanTanzaniaThailandTimor-LesteTogoTongaTrinidad and TobagoTunisiaTurkeyTurkmenistanTurks and Caicos IslandsTuvaluUgandaUkraineUnited Arab EmiratesUnited KingdomUnited StatesUruguayUzbekistanVanuatuVenezuela, RBVietnamVirgin Islands (U.S.)West Bank and GazaYemen, Rep.ZambiaZimbabwe Timeline:
This timeline shows a graph from 1971 to 2016 of Libya. No data until 1970. Number of actual observations by date: 46.
Source name:
World Development Indicators
Source organization:
World Bank staff estimates based on sources and methods in World Bank's "The Changing Wealth of Nations: Measuring Sustainable Development in the New Millennium" (2011).
Categories, topics:
Economy & Growth, Energy & Mining, Environment
Last updated:
apr 23, 2017
Indicators value changes by year
Maximum:
27.369 bln
jan 1, 2009
At the date of observation
Value
Absolute change
Change from previous value
jan 1, 1971
1.16 bln
+1.16 bln
0.0%
jan 1, 1972
1.181 bln
+21.538 mln
1.86%
jan 1, 1973
970.2 mln
-210.969 mln
-17.86%
jan 1, 1974
1.462 bln
+491.742 mln
50.68%
jan 1, 1975
3.533 bln
+2.071 bln
141.69%
jan 1, 1976
3.155 bln
-378.761 mln
-10.72%
jan 1, 1977
5.154 bln
+1.999 bln
63.37%
jan 1, 1978
6.001 bln
+847.631 mln
16.45%
jan 1, 1979
5.748 bln
-252.798 mln
-4.21%
jan 1, 1980
15.004 bln
+9.256 bln
161.02%
jan 1, 1981
14.116 bln
-887.73 mln
-5.92%
jan 1, 1982
6.754 bln
-7.363 bln
-52.16%
jan 1, 1983
5.638 bln
-1.116 bln
-16.52%
jan 1, 1984
4.78 bln
-857.259 mln
-15.21%
jan 1, 1985
4.609 bln
-171.505 mln
-3.59%
jan 1, 1986
4.184 bln
-424.994 mln
-9.22%
jan 1, 1987
2.027 bln
-2.157 bln
-51.55%
jan 1, 1988
2.585 bln
+557.605 mln
27.51%
jan 1, 1989
2.121 bln
-463.747 mln
-17.94%
jan 1, 1990
2.731 bln
+610.326 mln
28.78%
jan 1, 1991
4.668 bln
+1.937 bln
70.91%
jan 1, 1992
4.606 bln
-62.184 mln
-1.33%
jan 1, 1993
4.113 bln
-492.472 mln
-10.69%
jan 1, 1994
3.36 bln
-753.254 mln
-18.31%
jan 1, 1995
3.171 bln
-189.032 mln
-5.63%
jan 1, 1996
3.344 bln
+172.588 mln
5.44%
jan 1, 1997
4.125 bln
+781.457 mln
23.37%
jan 1, 1998
3.824 bln
-300.839 mln
-7.29%
jan 1, 1999
2.393 bln
-1.431 bln
-37.42%
jan 1, 2000
2.995 bln
+601.585 mln
25.14%
jan 1, 2001
5.618 bln
+2.623 bln
87.6%
jan 1, 2002
4.604 bln
-1.014 bln
-18.05%
jan 1, 2003
4.576 bln
-27.982 mln
-0.61%
jan 1, 2004
5.966 bln
+1.39 bln
30.38%
jan 1, 2005
9.154 bln
+3.188 bln
53.43%
jan 1, 2006
14.285 bln
+5.131 bln
56.06%
jan 1, 2007
17.835 bln
+3.549 bln
24.85%
jan 1, 2008
20.029 bln
+2.194 bln
12.3%
jan 1, 2009
27.369 bln
+7.341 bln
36.65%
jan 1, 2010
14.508 bln
-12.862 bln
-46.99%
jan 1, 2011
19.401 bln
+4.894 bln
33.73%
jan 1, 2012
7.654 bln
-11.748 bln
-60.55%
jan 1, 2013
21.467 bln
+13.814 bln
180.48%
jan 1, 2014
14.448 bln
-7.02 bln
-32.7%
jan 1, 2015
6.7 bln
-7.748 bln
-53.63%
jan 1, 2016
0.0
-6.7 bln
-100.0%
Ranking of countries by current statistics by years


Comments: