29
/
en
AIzaSyAYiBZKx7MnpbEhh9jyipgxe19OcubqV5w
April 1, 2024
138968
Germany
DEU
true
2
1
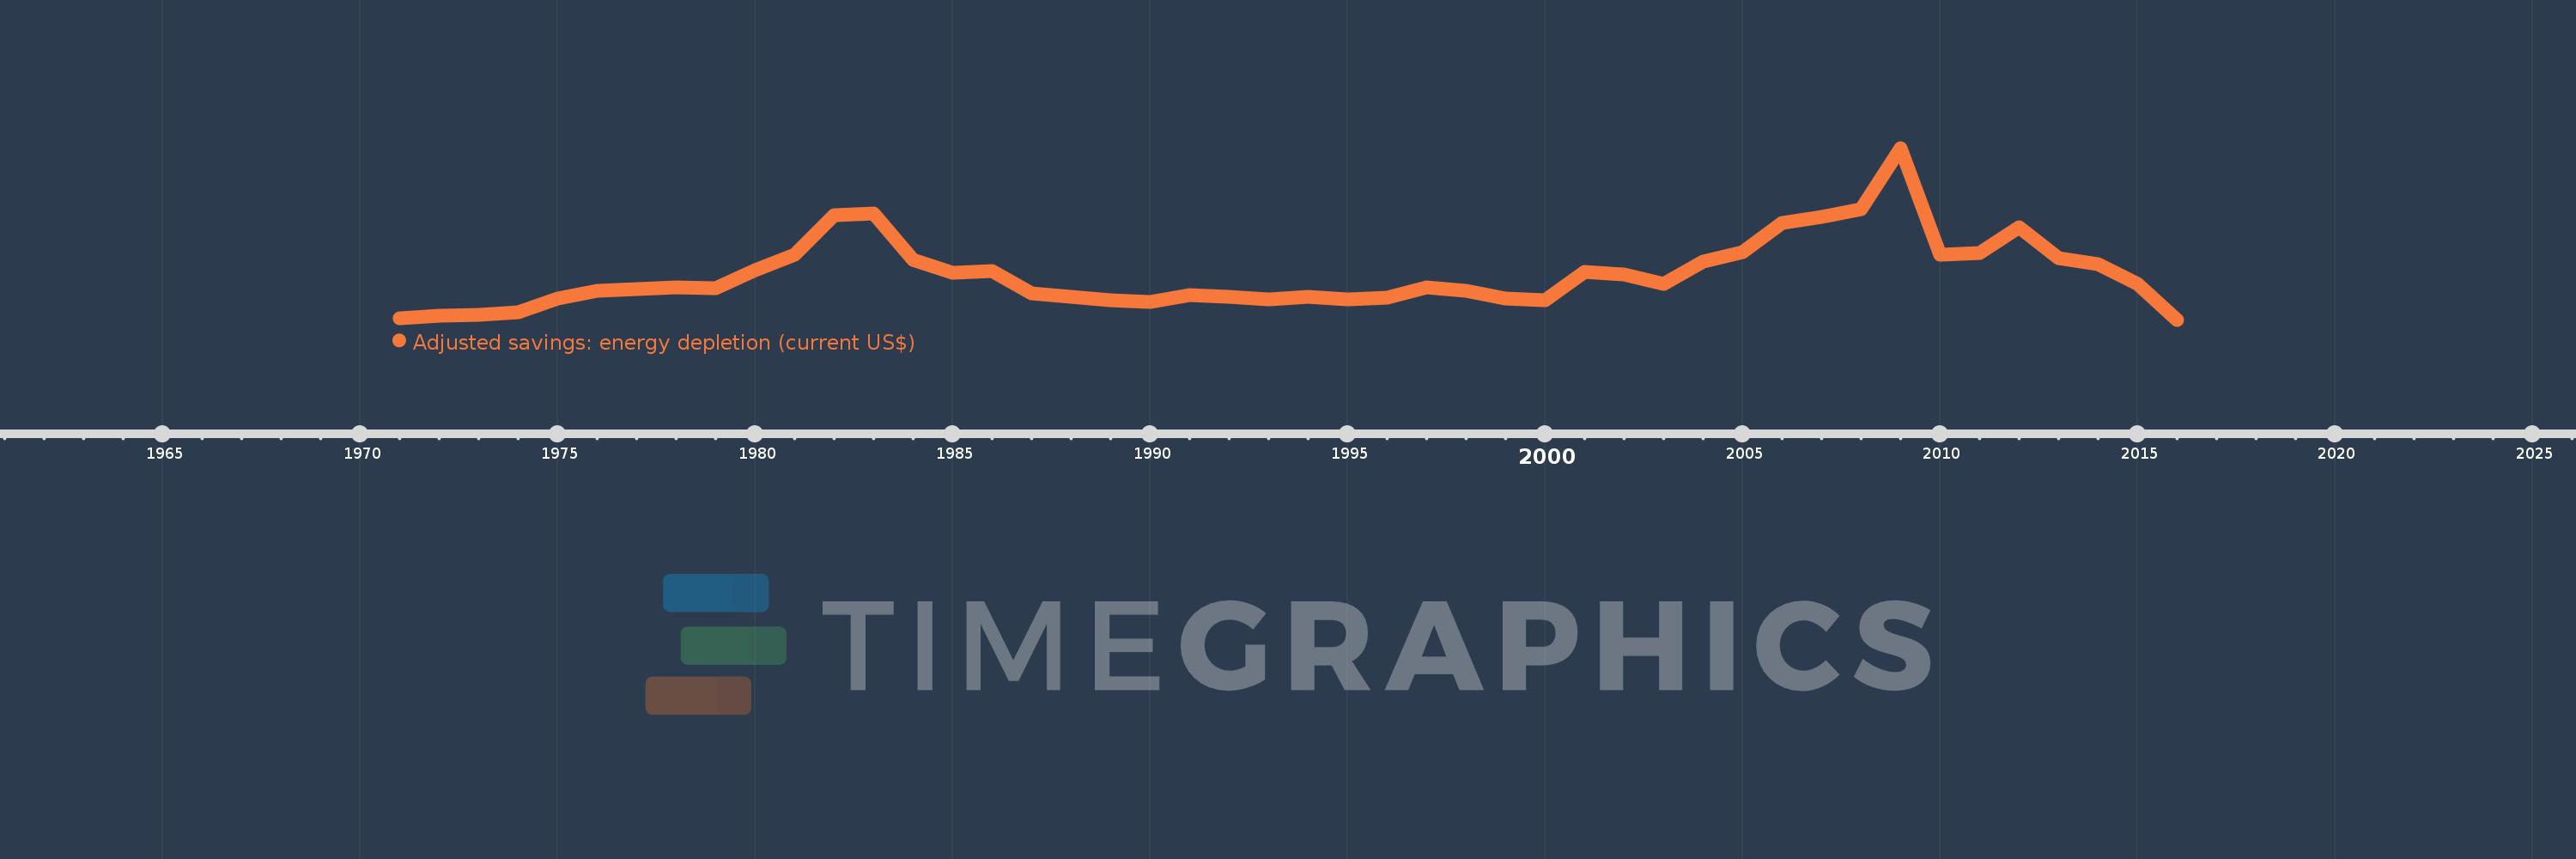
Adjusted savings: energy depletion (current US$)
2016,2015,2014,2013,2012,2011,2010,2009,2008,2007,2006,2005,2004,2003,2002,2001,2000,1999,1998,1997,1996,1995,1994,1993,1992,1991,1990,1989,1988,1987,1986,1985,1984,1983,1982,1981,1980,1979,1978,1977,1976,1975,1974,1973,1972,1971
This statistics in other country:
AfghanistanAlbaniaAlgeriaAmerican SamoaAndorraAngolaAntigua and BarbudaArgentinaArmeniaArubaAustraliaAustriaAzerbaijanBahamas, TheBahrainBangladeshBarbadosBelarusBelgiumBelizeBeninBermudaBhutanBoliviaBosnia and HerzegovinaBotswanaBrazilBrunei DarussalamBulgariaBurkina FasoBurundiCabo VerdeCambodiaCameroonCanadaCayman IslandsCentral African RepublicChadChannel IslandsChileChinaColombiaComorosCongo, Dem. Rep.Congo, Rep.Costa RicaCote d'IvoireCroatiaCubaCuracaoCyprusCzech RepublicDenmarkDjiboutiDominicaDominican RepublicEcuadorEgypt, Arab Rep.El SalvadorEquatorial GuineaEritreaEstoniaEthiopiaFaroe IslandsFijiFinlandFranceFrench PolynesiaGabonGambia, TheGeorgiaGermanyGhanaGibraltarGreeceGreenlandGrenadaGuamGuatemalaGuineaGuinea-BissauGuyanaHaitiHondurasHong Kong SAR, ChinaHungaryIcelandIndiaIndonesiaIran, Islamic Rep.IraqIrelandIsle of ManIsraelItalyJamaicaJapanJordanKazakhstanKenyaKiribatiKorea, Dem. People’s Rep.Korea, Rep.KosovoKuwaitKyrgyz RepublicLao PDRLatviaLebanonLesothoLiberiaLibyaLiechtensteinLithuaniaLuxembourgMacao SAR, ChinaMacedonia, FYRMadagascarMalawiMalaysiaMaldivesMaliMaltaMarshall IslandsMauritaniaMauritiusMexicoMicronesia, Fed. Sts.MoldovaMonacoMongoliaMontenegroMoroccoMozambiqueMyanmarNamibiaNepalNetherlandsNew CaledoniaNew ZealandNicaraguaNigerNigeriaNorthern Mariana IslandsNorwayOmanPakistanPalauPanamaPapua New GuineaParaguayPeruPhilippinesPolandPortugalPuerto RicoQatarRomaniaRussian FederationRwandaSamoaSan MarinoSao Tome and PrincipeSaudi ArabiaSenegalSerbiaSeychellesSierra LeoneSingaporeSint Maarten (Dutch part)Slovak RepublicSloveniaSolomon IslandsSomaliaSouth AfricaSouth SudanSpainSri LankaSt. Kitts and NevisSt. LuciaSt. Martin (French part)St. Vincent and the GrenadinesSudanSurinameSwazilandSwedenSwitzerlandSyrian Arab RepublicTajikistanTanzaniaThailandTimor-LesteTogoTongaTrinidad and TobagoTunisiaTurkeyTurkmenistanTurks and Caicos IslandsTuvaluUgandaUkraineUnited Arab EmiratesUnited KingdomUnited StatesUruguayUzbekistanVanuatuVenezuela, RBVietnamVirgin Islands (U.S.)West Bank and GazaYemen, Rep.ZambiaZimbabwe Timeline:
This timeline shows a graph from 1971 to 2016 of Germany. No data until 1970. Number of actual observations by date: 46.
Source name:
World Development Indicators
Source organization:
World Bank staff estimates based on sources and methods in World Bank's "The Changing Wealth of Nations: Measuring Sustainable Development in the New Millennium" (2011).
Categories, topics:
Economy & Growth, Energy & Mining, Environment
Last updated:
apr 23, 2017
Indicators value changes by year
Maximum:
7.667 bln
jan 1, 2009
At the date of observation
Value
Absolute change
Change from previous value
jan 1, 1971
69.825 mln
+69.825 mln
0.0%
jan 1, 1972
181.566 mln
+111.741 mln
160.03%
jan 1, 1973
222.642 mln
+41.075 mln
22.62%
jan 1, 1974
327.75 mln
+105.108 mln
47.21%
jan 1, 1975
954.113 mln
+626.363 mln
191.11%
jan 1, 1976
1.278 bln
+323.399 mln
33.9%
jan 1, 1977
1.38 bln
+102.146 mln
8.0%
jan 1, 1978
1.435 bln
+55.717 mln
4.04%
jan 1, 1979
1.389 bln
-46.026 mln
-3.21%
jan 1, 1980
2.214 bln
+824.829 mln
59.37%
jan 1, 1981
2.894 bln
+679.536 mln
30.69%
jan 1, 1982
4.67 bln
+1.776 bln
61.38%
jan 1, 1983
4.751 bln
+81.197 mln
1.74%
jan 1, 1984
2.67 bln
-2.081 bln
-43.8%
jan 1, 1985
2.11 bln
-560.321 mln
-20.99%
jan 1, 1986
2.168 bln
+58.219 mln
2.76%
jan 1, 1987
1.16 bln
-1.008 bln
-46.5%
jan 1, 1988
1.042 bln
-117.474 mln
-10.13%
jan 1, 1989
851.635 mln
-190.781 mln
-18.3%
jan 1, 1990
803.226 mln
-48.408 mln
-5.68%
jan 1, 1991
1.115 bln
+311.525 mln
38.78%
jan 1, 1992
1.034 bln
-81.134 mln
-7.28%
jan 1, 1993
922.01 mln
-111.608 mln
-10.8%
jan 1, 1994
1.017 bln
+94.628 mln
10.26%
jan 1, 1995
908.061 mln
-108.577 mln
-10.68%
jan 1, 1996
996.228 mln
+88.167 mln
9.71%
jan 1, 1997
1.44 bln
+444.083 mln
44.58%
jan 1, 1998
1.304 bln
-136.796 mln
-9.5%
jan 1, 1999
932.185 mln
-371.329 mln
-28.49%
jan 1, 2000
876.883 mln
-55.302 mln
-5.93%
jan 1, 2001
2.148 bln
+1.271 bln
144.92%
jan 1, 2002
2.039 bln
-108.488 mln
-5.05%
jan 1, 2003
1.589 bln
-449.808 mln
-22.06%
jan 1, 2004
2.587 bln
+997.262 mln
62.75%
jan 1, 2005
3.003 bln
+415.922 mln
16.08%
jan 1, 2006
4.324 bln
+1.321 bln
44.01%
jan 1, 2007
4.589 bln
+264.825 mln
6.12%
jan 1, 2008
4.947 bln
+358.392 mln
7.81%
jan 1, 2009
7.667 bln
+2.72 bln
54.98%
jan 1, 2010
2.896 bln
-4.771 bln
-62.23%
jan 1, 2011
2.987 bln
+90.618 mln
3.13%
jan 1, 2012
4.116 bln
+1.129 bln
37.82%
jan 1, 2013
2.761 bln
-1.354 bln
-32.91%
jan 1, 2014
2.462 bln
-299.191 mln
-10.83%
jan 1, 2015
1.589 bln
-873.607 mln
-35.48%
jan 1, 2016
0.0
-1.589 bln
-100.0%
Ranking of countries by current statistics by years


Comments: