29
/
en
AIzaSyAYiBZKx7MnpbEhh9jyipgxe19OcubqV5w
April 1, 2024
223132
Philippines
PHL
true
2
1
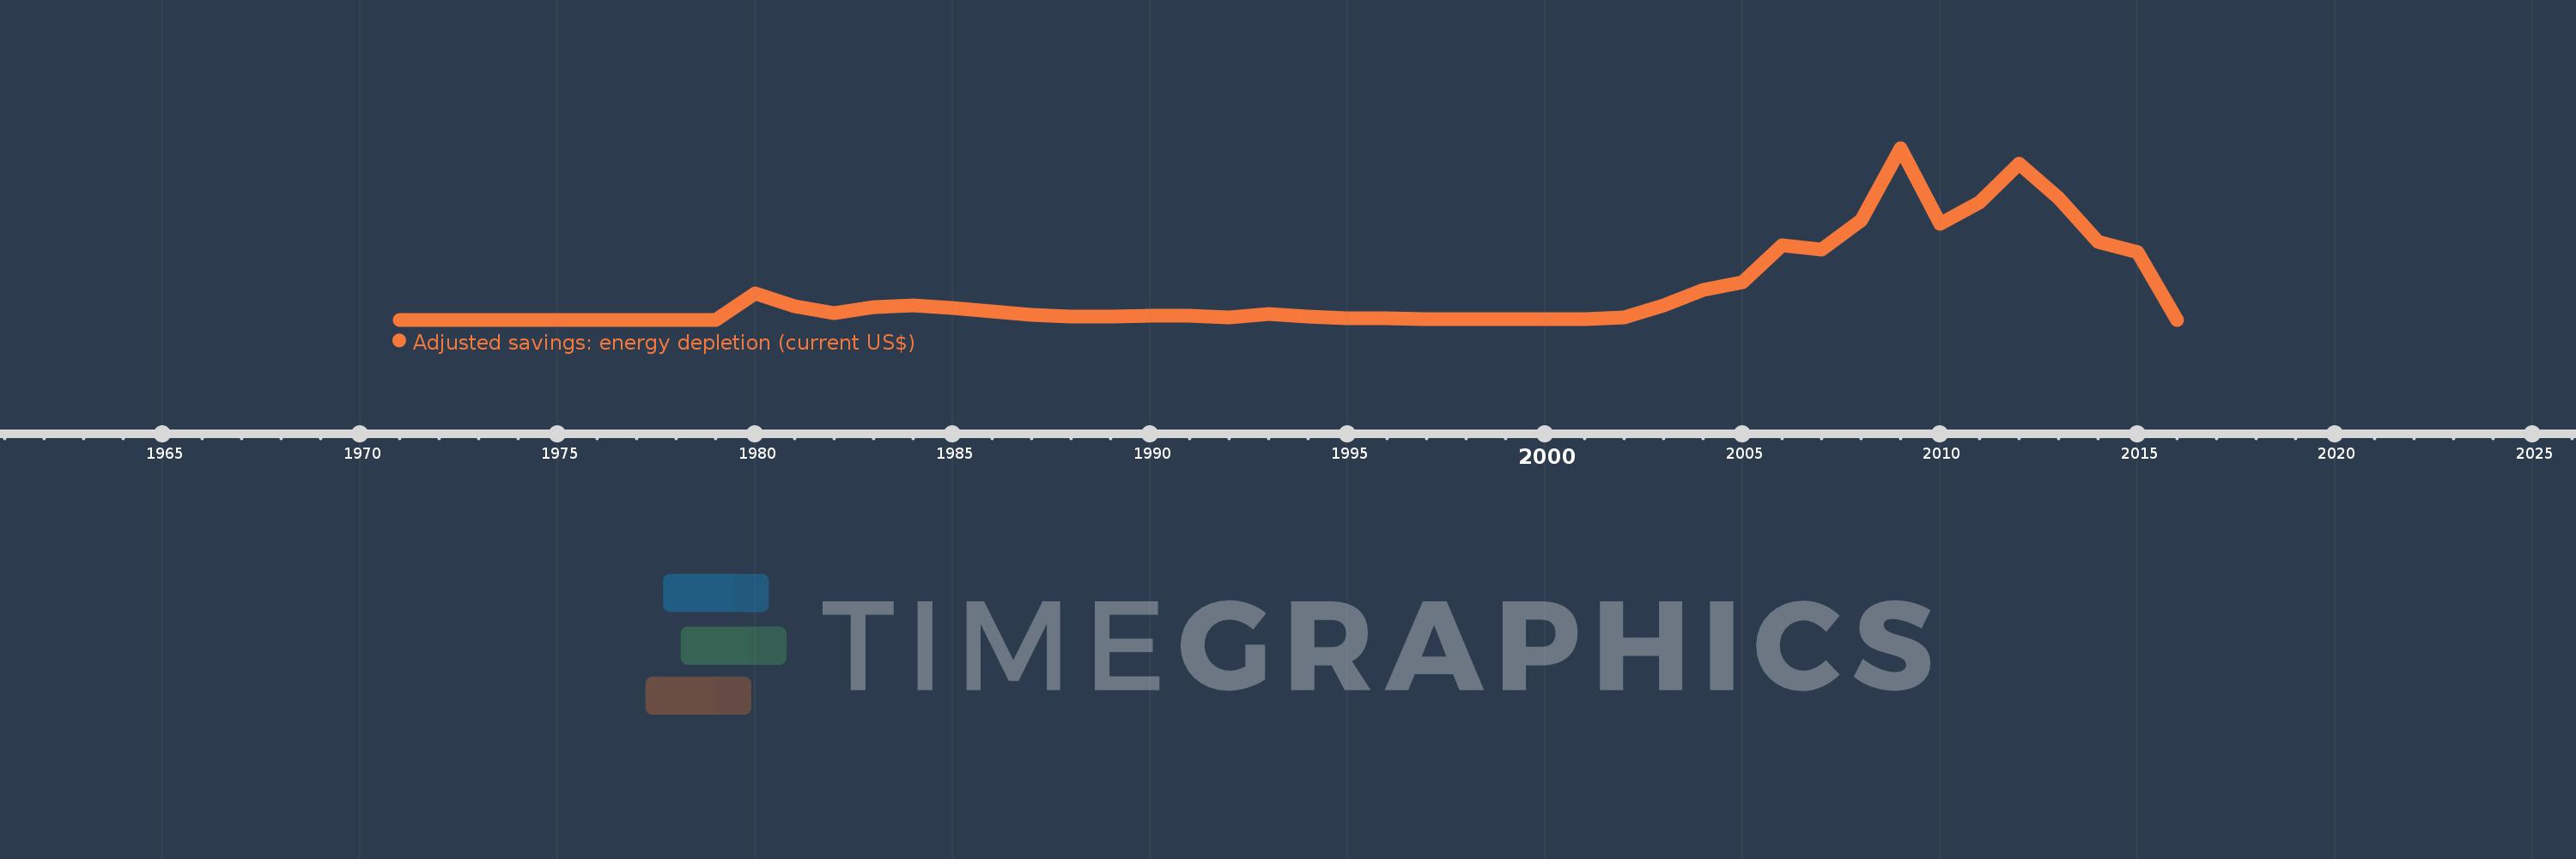
Adjusted savings: energy depletion (current US$)
2016,2015,2014,2013,2012,2011,2010,2009,2008,2007,2006,2005,2004,2003,2002,2001,2000,1999,1998,1997,1996,1995,1994,1993,1992,1991,1990,1989,1988,1987,1986,1985,1984,1983,1982,1981,1980,1979,1978,1977,1976,1975,1974,1973,1972,1971
This statistics in other country:
AfghanistanAlbaniaAlgeriaAmerican SamoaAndorraAngolaAntigua and BarbudaArgentinaArmeniaArubaAustraliaAustriaAzerbaijanBahamas, TheBahrainBangladeshBarbadosBelarusBelgiumBelizeBeninBermudaBhutanBoliviaBosnia and HerzegovinaBotswanaBrazilBrunei DarussalamBulgariaBurkina FasoBurundiCabo VerdeCambodiaCameroonCanadaCayman IslandsCentral African RepublicChadChannel IslandsChileChinaColombiaComorosCongo, Dem. Rep.Congo, Rep.Costa RicaCote d'IvoireCroatiaCubaCuracaoCyprusCzech RepublicDenmarkDjiboutiDominicaDominican RepublicEcuadorEgypt, Arab Rep.El SalvadorEquatorial GuineaEritreaEstoniaEthiopiaFaroe IslandsFijiFinlandFranceFrench PolynesiaGabonGambia, TheGeorgiaGermanyGhanaGibraltarGreeceGreenlandGrenadaGuamGuatemalaGuineaGuinea-BissauGuyanaHaitiHondurasHong Kong SAR, ChinaHungaryIcelandIndiaIndonesiaIran, Islamic Rep.IraqIrelandIsle of ManIsraelItalyJamaicaJapanJordanKazakhstanKenyaKiribatiKorea, Dem. People’s Rep.Korea, Rep.KosovoKuwaitKyrgyz RepublicLao PDRLatviaLebanonLesothoLiberiaLibyaLiechtensteinLithuaniaLuxembourgMacao SAR, ChinaMacedonia, FYRMadagascarMalawiMalaysiaMaldivesMaliMaltaMarshall IslandsMauritaniaMauritiusMexicoMicronesia, Fed. Sts.MoldovaMonacoMongoliaMontenegroMoroccoMozambiqueMyanmarNamibiaNepalNetherlandsNew CaledoniaNew ZealandNicaraguaNigerNigeriaNorthern Mariana IslandsNorwayOmanPakistanPalauPanamaPapua New GuineaParaguayPeruPhilippinesPolandPortugalPuerto RicoQatarRomaniaRussian FederationRwandaSamoaSan MarinoSao Tome and PrincipeSaudi ArabiaSenegalSerbiaSeychellesSierra LeoneSingaporeSint Maarten (Dutch part)Slovak RepublicSloveniaSolomon IslandsSomaliaSouth AfricaSouth SudanSpainSri LankaSt. Kitts and NevisSt. LuciaSt. Martin (French part)St. Vincent and the GrenadinesSudanSurinameSwazilandSwedenSwitzerlandSyrian Arab RepublicTajikistanTanzaniaThailandTimor-LesteTogoTongaTrinidad and TobagoTunisiaTurkeyTurkmenistanTurks and Caicos IslandsTuvaluUgandaUkraineUnited Arab EmiratesUnited KingdomUnited StatesUruguayUzbekistanVanuatuVenezuela, RBVietnamVirgin Islands (U.S.)West Bank and GazaYemen, Rep.ZambiaZimbabwe Timeline:
This timeline shows a graph from 1971 to 2016 of Philippines. No data until 1970. Number of actual observations by date: 46.
Source name:
World Development Indicators
Source organization:
World Bank staff estimates based on sources and methods in World Bank's "The Changing Wealth of Nations: Measuring Sustainable Development in the New Millennium" (2011).
Categories, topics:
Economy & Growth, Energy & Mining, Environment
Last updated:
apr 23, 2017
Indicators value changes by year
Maximum:
1.55 bln
jan 1, 2009
At the date of observation
Value
Absolute change
Change from previous value
jan 1, 1972
13.087K
+13.087K
%
jan 1, 1973
13.36K
+272.348
2.08%
jan 1, 1974
12.156K
-1.204K
-9.01%
jan 1, 1975
0.0
-12.156K
-100.0%
jan 1, 1976
77.612K
+77.612K
%
jan 1, 1977
126.361K
+48.749K
62.81%
jan 1, 1978
332.619K
+206.259K
163.23%
jan 1, 1979
393.36K
+60.74K
18.26%
jan 1, 1980
236.273 mln
+235.88 mln
59.97K%
jan 1, 1981
119.625 mln
-116.648 mln
-49.37%
jan 1, 1982
61.563 mln
-58.062 mln
-48.54%
jan 1, 1983
113.721 mln
+52.158 mln
84.72%
jan 1, 1984
130.815 mln
+17.093 mln
15.03%
jan 1, 1985
106.901 mln
-23.914 mln
-18.28%
jan 1, 1986
74.933 mln
-31.968 mln
-29.9%
jan 1, 1987
41.185 mln
-33.748 mln
-45.04%
jan 1, 1988
29.135 mln
-12.05 mln
-29.26%
jan 1, 1989
26.412 mln
-2.723 mln
-9.34%
jan 1, 1990
32.711 mln
+6.299 mln
23.85%
jan 1, 1991
39.307 mln
+6.596 mln
20.16%
jan 1, 1992
19.521 mln
-19.786 mln
-50.34%
jan 1, 1993
50.494 mln
+30.973 mln
158.67%
jan 1, 1994
26.804 mln
-23.691 mln
-46.92%
jan 1, 1995
14.182 mln
-12.622 mln
-47.09%
jan 1, 1996
12.675 mln
-1.507 mln
-10.63%
jan 1, 1997
7.229 mln
-5.445 mln
-42.96%
jan 1, 1998
5.617 mln
-1.613 mln
-22.31%
jan 1, 1999
3.401 mln
-2.216 mln
-39.45%
jan 1, 2000
3.368 mln
-33.505K
-0.99%
jan 1, 2001
7.35 mln
+3.982 mln
118.25%
jan 1, 2002
21.93 mln
+14.58 mln
198.38%
jan 1, 2003
132.839 mln
+110.909 mln
505.74%
jan 1, 2004
270.229 mln
+137.39 mln
103.43%
jan 1, 2005
336.064 mln
+65.835 mln
24.36%
jan 1, 2006
670.877 mln
+334.813 mln
99.63%
jan 1, 2007
631.363 mln
-39.514 mln
-5.89%
jan 1, 2008
893.294 mln
+261.931 mln
41.49%
jan 1, 2009
1.55 bln
+656.225 mln
73.46%
jan 1, 2010
865.787 mln
-683.731 mln
-44.13%
jan 1, 2011
1.06 bln
+194.399 mln
22.45%
jan 1, 2012
1.405 bln
+344.467 mln
32.49%
jan 1, 2013
1.098 bln
-306.347 mln
-21.81%
jan 1, 2014
701.796 mln
-396.51 mln
-36.1%
jan 1, 2015
612.12 mln
-89.676 mln
-12.78%
jan 1, 2016
0.0
-612.12 mln
-100.0%
Ranking of countries by current statistics by years


Comments: