29
/
en
AIzaSyAYiBZKx7MnpbEhh9jyipgxe19OcubqV5w
April 1, 2024
281872
Vietnam
VNM
true
2
1
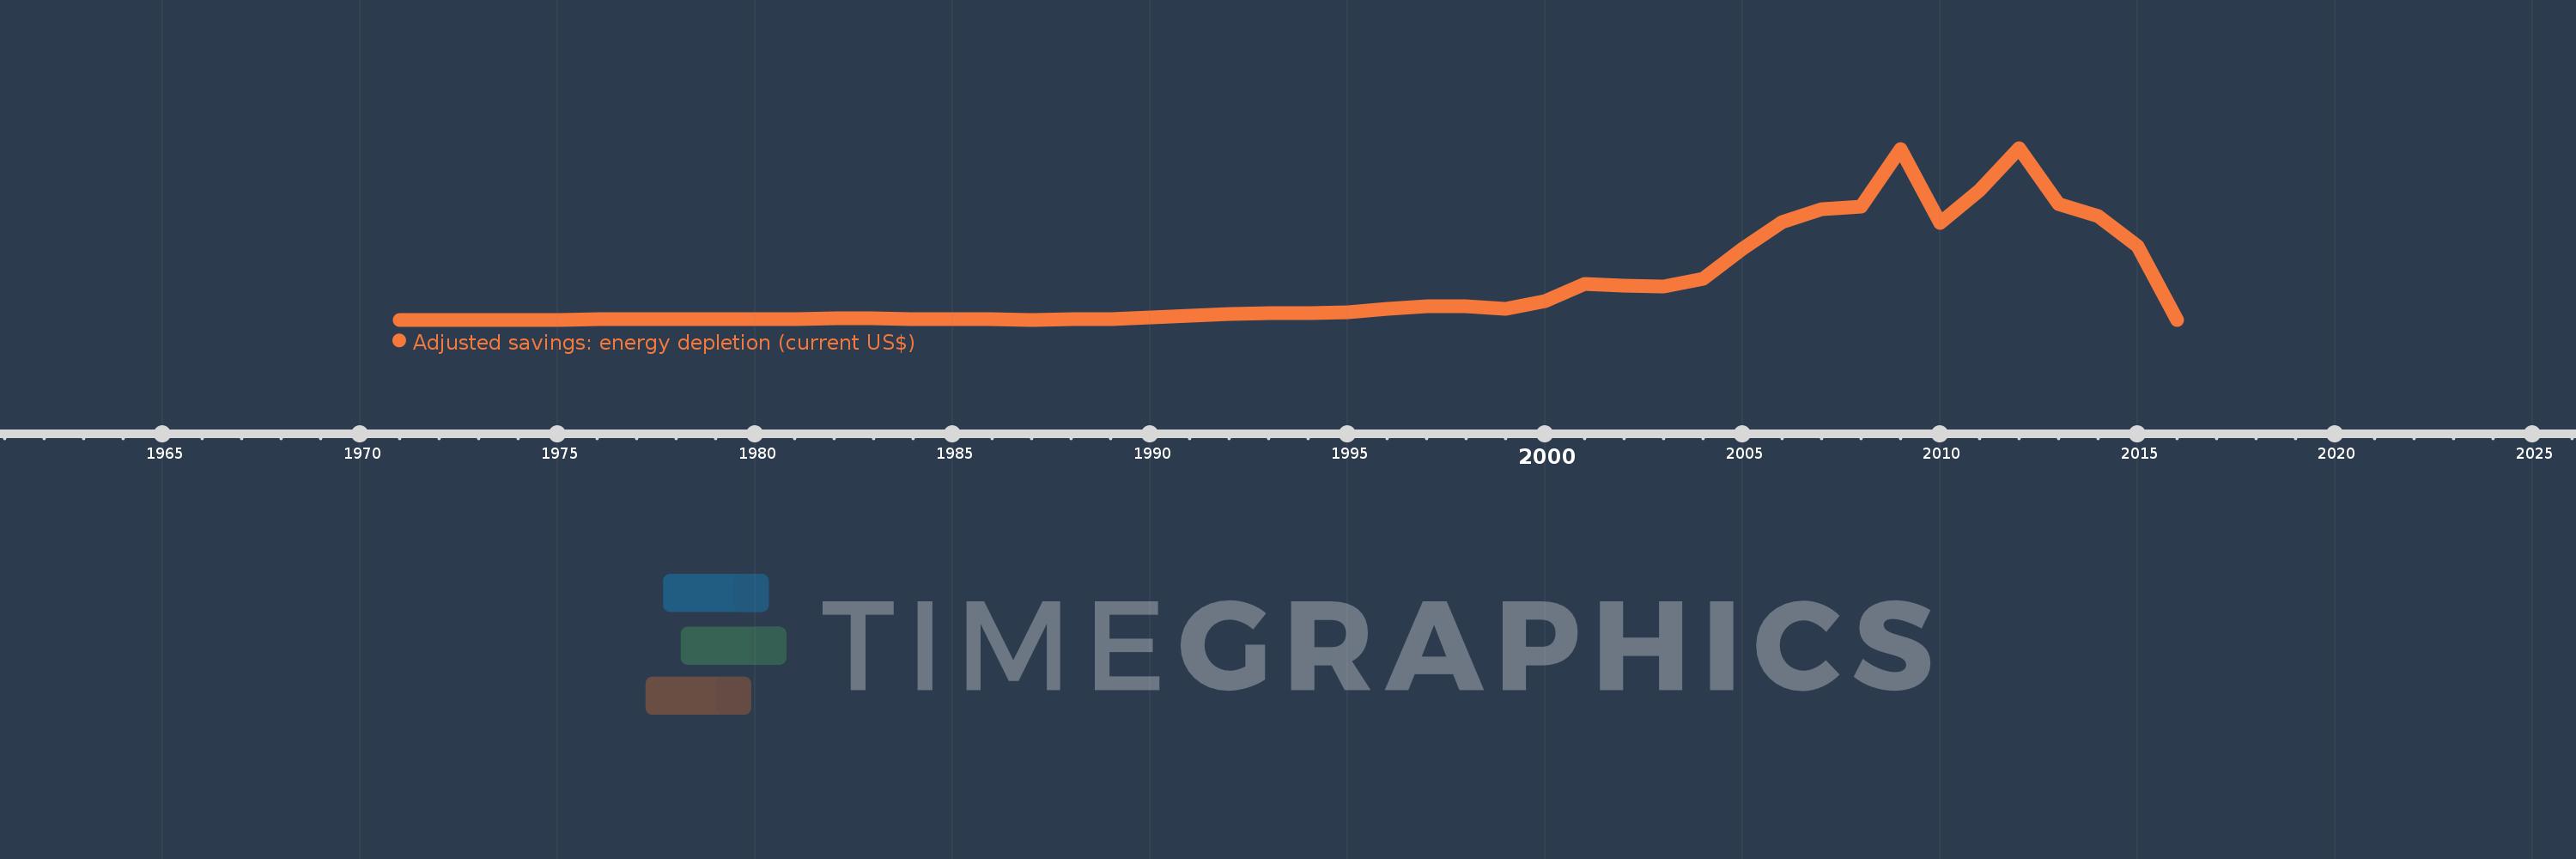
Adjusted savings: energy depletion (current US$)
2016,2015,2014,2013,2012,2011,2010,2009,2008,2007,2006,2005,2004,2003,2002,2001,2000,1999,1998,1997,1996,1995,1994,1993,1992,1991,1990,1989,1988,1987,1986,1985,1984,1983,1982,1981,1980,1979,1978,1977,1976,1975,1974,1973,1972,1971
This statistics in other country:
AfghanistanAlbaniaAlgeriaAmerican SamoaAndorraAngolaAntigua and BarbudaArgentinaArmeniaArubaAustraliaAustriaAzerbaijanBahamas, TheBahrainBangladeshBarbadosBelarusBelgiumBelizeBeninBermudaBhutanBoliviaBosnia and HerzegovinaBotswanaBrazilBrunei DarussalamBulgariaBurkina FasoBurundiCabo VerdeCambodiaCameroonCanadaCayman IslandsCentral African RepublicChadChannel IslandsChileChinaColombiaComorosCongo, Dem. Rep.Congo, Rep.Costa RicaCote d'IvoireCroatiaCubaCuracaoCyprusCzech RepublicDenmarkDjiboutiDominicaDominican RepublicEcuadorEgypt, Arab Rep.El SalvadorEquatorial GuineaEritreaEstoniaEthiopiaFaroe IslandsFijiFinlandFranceFrench PolynesiaGabonGambia, TheGeorgiaGermanyGhanaGibraltarGreeceGreenlandGrenadaGuamGuatemalaGuineaGuinea-BissauGuyanaHaitiHondurasHong Kong SAR, ChinaHungaryIcelandIndiaIndonesiaIran, Islamic Rep.IraqIrelandIsle of ManIsraelItalyJamaicaJapanJordanKazakhstanKenyaKiribatiKorea, Dem. People’s Rep.Korea, Rep.KosovoKuwaitKyrgyz RepublicLao PDRLatviaLebanonLesothoLiberiaLibyaLiechtensteinLithuaniaLuxembourgMacao SAR, ChinaMacedonia, FYRMadagascarMalawiMalaysiaMaldivesMaliMaltaMarshall IslandsMauritaniaMauritiusMexicoMicronesia, Fed. Sts.MoldovaMonacoMongoliaMontenegroMoroccoMozambiqueMyanmarNamibiaNepalNetherlandsNew CaledoniaNew ZealandNicaraguaNigerNigeriaNorthern Mariana IslandsNorwayOmanPakistanPalauPanamaPapua New GuineaParaguayPeruPhilippinesPolandPortugalPuerto RicoQatarRomaniaRussian FederationRwandaSamoaSan MarinoSao Tome and PrincipeSaudi ArabiaSenegalSerbiaSeychellesSierra LeoneSingaporeSint Maarten (Dutch part)Slovak RepublicSloveniaSolomon IslandsSomaliaSouth AfricaSouth SudanSpainSri LankaSt. Kitts and NevisSt. LuciaSt. Martin (French part)St. Vincent and the GrenadinesSudanSurinameSwazilandSwedenSwitzerlandSyrian Arab RepublicTajikistanTanzaniaThailandTimor-LesteTogoTongaTrinidad and TobagoTunisiaTurkeyTurkmenistanTurks and Caicos IslandsTuvaluUgandaUkraineUnited Arab EmiratesUnited KingdomUnited StatesUruguayUzbekistanVanuatuVenezuela, RBVietnamVirgin Islands (U.S.)West Bank and GazaYemen, Rep.ZambiaZimbabwe Timeline:
This timeline shows a graph from 1971 to 2016 of Vietnam. No data until 1970. Number of actual observations by date: 46.
Source name:
World Development Indicators
Source organization:
World Bank staff estimates based on sources and methods in World Bank's "The Changing Wealth of Nations: Measuring Sustainable Development in the New Millennium" (2011).
Categories, topics:
Economy & Growth, Energy & Mining, Environment
Last updated:
apr 23, 2017
Indicators value changes by year
Maximum:
12.645 bln
jan 1, 2012
At the date of observation
Value
Absolute change
Change from previous value
jan 1, 1975
1.885 mln
+1.885 mln
%
jan 1, 1976
36.043 mln
+34.157 mln
1.81K%
jan 1, 1977
39.236 mln
+3.194 mln
8.86%
jan 1, 1978
43.634 mln
+4.397 mln
11.21%
jan 1, 1979
28.755 mln
-14.879 mln
-34.1%
jan 1, 1980
22.748 mln
-6.007 mln
-20.89%
jan 1, 1981
49.072 mln
+26.325 mln
115.72%
jan 1, 1982
121.031 mln
+71.959 mln
146.64%
jan 1, 1983
137.006 mln
+15.975 mln
13.2%
jan 1, 1984
60.245 mln
-76.762 mln
-56.03%
jan 1, 1985
28.189 mln
-32.056 mln
-53.21%
jan 1, 1986
42.389 mln
+14.2 mln
50.38%
jan 1, 1987
10.888 mln
-31.501 mln
-74.31%
jan 1, 1988
22.826 mln
+11.938 mln
109.65%
jan 1, 1989
53.961 mln
+31.135 mln
136.4%
jan 1, 1990
147.379 mln
+93.418 mln
173.12%
jan 1, 1991
304.317 mln
+156.938 mln
106.49%
jan 1, 1992
411.36 mln
+107.043 mln
35.17%
jan 1, 1993
491.481 mln
+80.12 mln
19.48%
jan 1, 1994
494.602 mln
+3.122 mln
0.64%
jan 1, 1995
561.139 mln
+66.537 mln
13.45%
jan 1, 1996
782.298 mln
+221.159 mln
39.41%
jan 1, 1997
979.397 mln
+197.099 mln
25.19%
jan 1, 1998
977.228 mln
-2.169 mln
-0.22%
jan 1, 1999
789.967 mln
-187.261 mln
-19.16%
jan 1, 2000
1.366 bln
+575.808 mln
72.89%
jan 1, 2001
2.634 bln
+1.268 bln
92.84%
jan 1, 2002
2.54 bln
-93.698 mln
-3.56%
jan 1, 2003
2.441 bln
-99.146 mln
-3.9%
jan 1, 2004
3.041 bln
+600.016 mln
24.58%
jan 1, 2005
5.252 bln
+2.211 bln
72.71%
jan 1, 2006
7.191 bln
+1.939 bln
36.92%
jan 1, 2007
8.126 bln
+934.705 mln
13.0%
jan 1, 2008
8.346 bln
+220.606 mln
2.71%
jan 1, 2009
12.538 bln
+4.191 bln
50.22%
jan 1, 2010
7.105 bln
-5.433 bln
-43.33%
jan 1, 2011
9.557 bln
+2.452 bln
34.51%
jan 1, 2012
12.645 bln
+3.088 bln
32.31%
jan 1, 2013
8.491 bln
-4.153 bln
-32.85%
jan 1, 2014
7.626 bln
-865.684 mln
-10.19%
jan 1, 2015
5.417 bln
-2.209 bln
-28.97%
jan 1, 2016
0.0
-5.417 bln
-100.0%
Ranking of countries by current statistics by years


Comments: