29
/
en
AIzaSyAYiBZKx7MnpbEhh9jyipgxe19OcubqV5w
April 1, 2024
99492
Cameroon
CMR
true
2
1
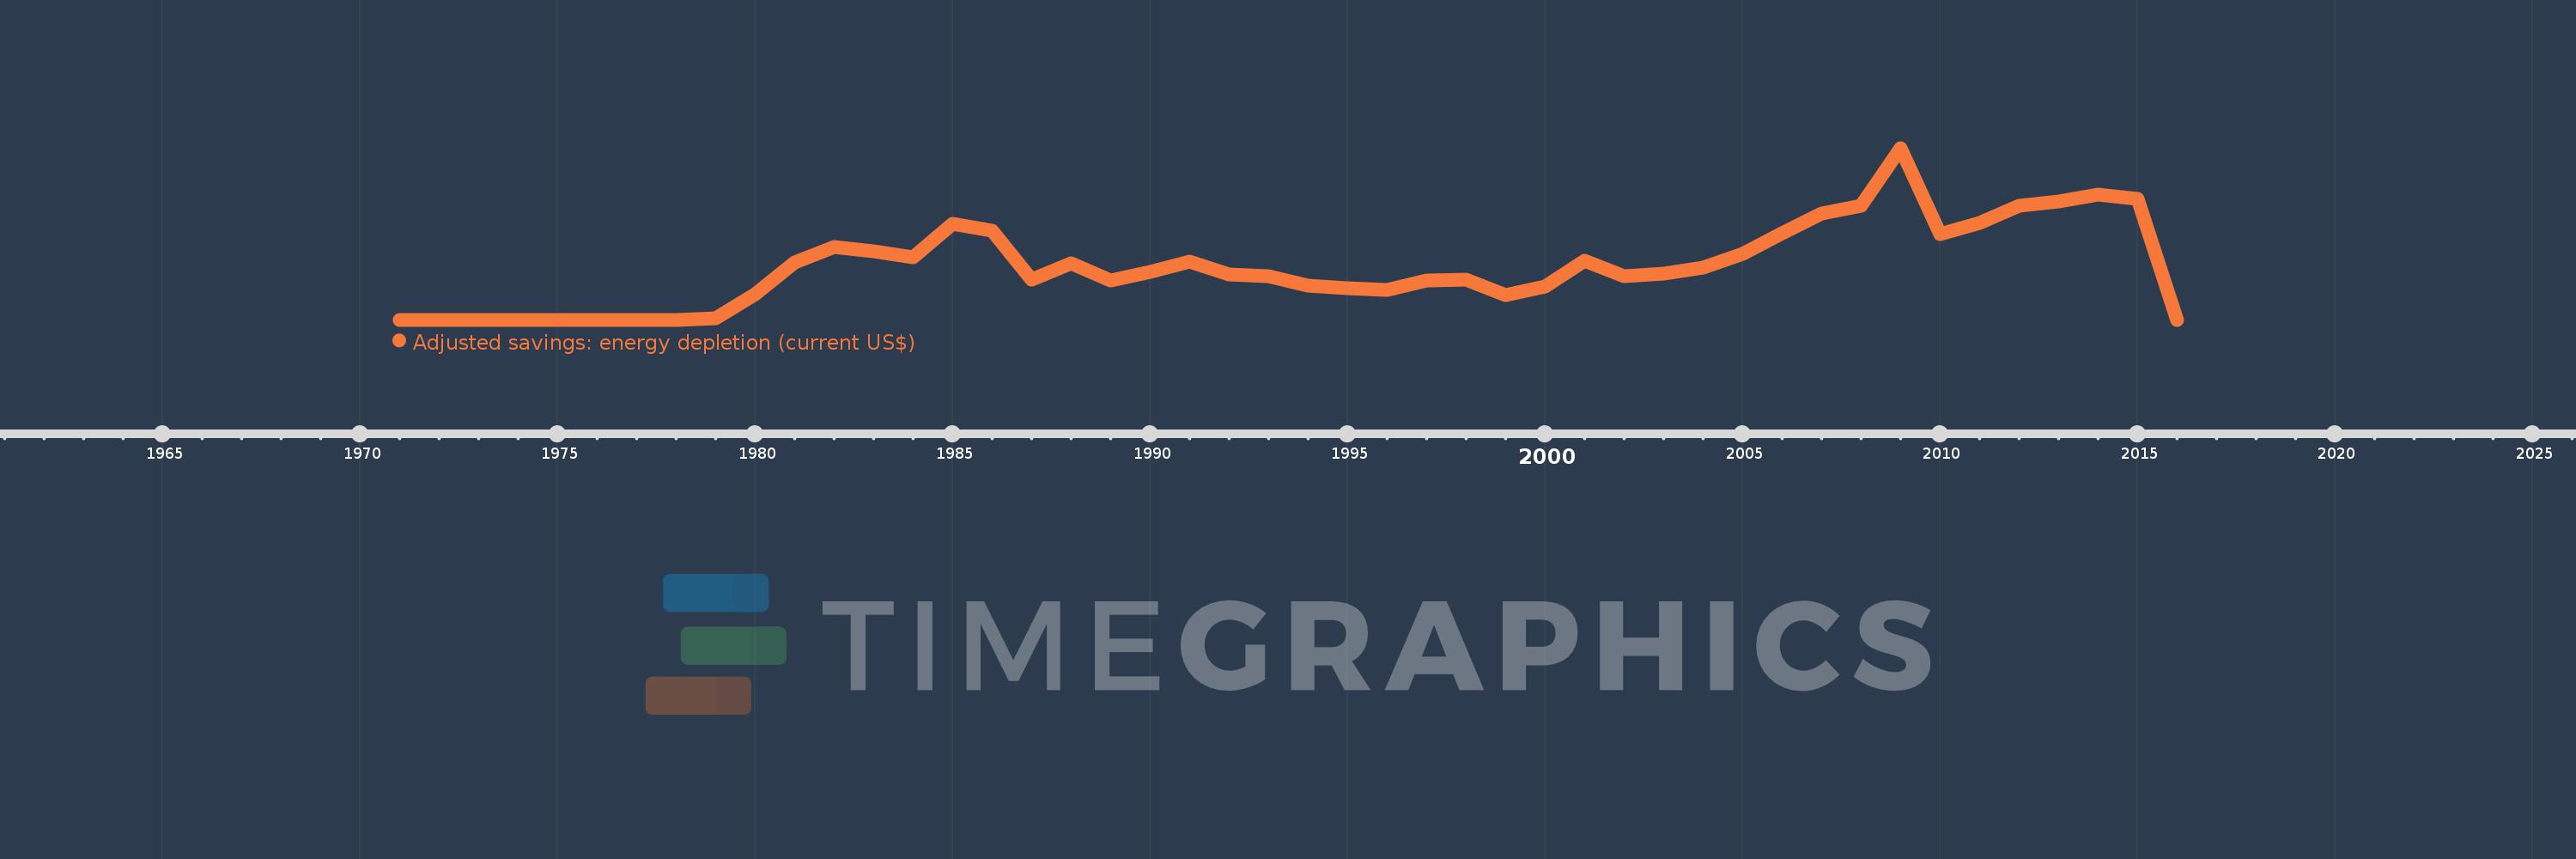
Adjusted savings: energy depletion (current US$)
2016,2015,2014,2013,2012,2011,2010,2009,2008,2007,2006,2005,2004,2003,2002,2001,2000,1999,1998,1997,1996,1995,1994,1993,1992,1991,1990,1989,1988,1987,1986,1985,1984,1983,1982,1981,1980,1979,1978,1977,1976,1975,1974,1973,1972,1971
This statistics in other country:
AfghanistanAlbaniaAlgeriaAmerican SamoaAndorraAngolaAntigua and BarbudaArgentinaArmeniaArubaAustraliaAustriaAzerbaijanBahamas, TheBahrainBangladeshBarbadosBelarusBelgiumBelizeBeninBermudaBhutanBoliviaBosnia and HerzegovinaBotswanaBrazilBrunei DarussalamBulgariaBurkina FasoBurundiCabo VerdeCambodiaCameroonCanadaCayman IslandsCentral African RepublicChadChannel IslandsChileChinaColombiaComorosCongo, Dem. Rep.Congo, Rep.Costa RicaCote d'IvoireCroatiaCubaCuracaoCyprusCzech RepublicDenmarkDjiboutiDominicaDominican RepublicEcuadorEgypt, Arab Rep.El SalvadorEquatorial GuineaEritreaEstoniaEthiopiaFaroe IslandsFijiFinlandFranceFrench PolynesiaGabonGambia, TheGeorgiaGermanyGhanaGibraltarGreeceGreenlandGrenadaGuamGuatemalaGuineaGuinea-BissauGuyanaHaitiHondurasHong Kong SAR, ChinaHungaryIcelandIndiaIndonesiaIran, Islamic Rep.IraqIrelandIsle of ManIsraelItalyJamaicaJapanJordanKazakhstanKenyaKiribatiKorea, Dem. People’s Rep.Korea, Rep.KosovoKuwaitKyrgyz RepublicLao PDRLatviaLebanonLesothoLiberiaLibyaLiechtensteinLithuaniaLuxembourgMacao SAR, ChinaMacedonia, FYRMadagascarMalawiMalaysiaMaldivesMaliMaltaMarshall IslandsMauritaniaMauritiusMexicoMicronesia, Fed. Sts.MoldovaMonacoMongoliaMontenegroMoroccoMozambiqueMyanmarNamibiaNepalNetherlandsNew CaledoniaNew ZealandNicaraguaNigerNigeriaNorthern Mariana IslandsNorwayOmanPakistanPalauPanamaPapua New GuineaParaguayPeruPhilippinesPolandPortugalPuerto RicoQatarRomaniaRussian FederationRwandaSamoaSan MarinoSao Tome and PrincipeSaudi ArabiaSenegalSerbiaSeychellesSierra LeoneSingaporeSint Maarten (Dutch part)Slovak RepublicSloveniaSolomon IslandsSomaliaSouth AfricaSouth SudanSpainSri LankaSt. Kitts and NevisSt. LuciaSt. Martin (French part)St. Vincent and the GrenadinesSudanSurinameSwazilandSwedenSwitzerlandSyrian Arab RepublicTajikistanTanzaniaThailandTimor-LesteTogoTongaTrinidad and TobagoTunisiaTurkeyTurkmenistanTurks and Caicos IslandsTuvaluUgandaUkraineUnited Arab EmiratesUnited KingdomUnited StatesUruguayUzbekistanVanuatuVenezuela, RBVietnamVirgin Islands (U.S.)West Bank and GazaYemen, Rep.ZambiaZimbabwe Timeline:
This timeline shows a graph from 1971 to 2016 of Cameroon. No data until 1970. Number of actual observations by date: 46.
Source name:
World Development Indicators
Source organization:
World Bank staff estimates based on sources and methods in World Bank's "The Changing Wealth of Nations: Measuring Sustainable Development in the New Millennium" (2011).
Categories, topics:
Economy & Growth, Energy & Mining, Environment
Last updated:
apr 23, 2017
Indicators value changes by year
Maximum:
2.463 bln
jan 1, 2009
At the date of observation
Value
Absolute change
Change from previous value
jan 1, 1978
1.478 mln
+1.478 mln
%
jan 1, 1979
23.159 mln
+21.681 mln
1.47K%
jan 1, 1980
368.959 mln
+345.8 mln
1.49K%
jan 1, 1981
822.27 mln
+453.311 mln
122.86%
jan 1, 1982
1.041 bln
+219.018 mln
26.64%
jan 1, 1983
983.268 mln
-58.019 mln
-5.57%
jan 1, 1984
895.671 mln
-87.597 mln
-8.91%
jan 1, 1985
1.377 bln
+481.631 mln
53.77%
jan 1, 1986
1.275 bln
-101.831 mln
-7.39%
jan 1, 1987
579.443 mln
-696.028 mln
-54.57%
jan 1, 1988
804.914 mln
+225.471 mln
38.91%
jan 1, 1989
568.715 mln
-236.199 mln
-29.34%
jan 1, 1990
687.41 mln
+118.695 mln
20.87%
jan 1, 1991
831.224 mln
+143.814 mln
20.92%
jan 1, 1992
644.806 mln
-186.418 mln
-22.43%
jan 1, 1993
623.2 mln
-21.606 mln
-3.35%
jan 1, 1994
493.026 mln
-130.173 mln
-20.89%
jan 1, 1995
454.376 mln
-38.65 mln
-7.84%
jan 1, 1996
425.858 mln
-28.519 mln
-6.28%
jan 1, 1997
557.197 mln
+131.34 mln
30.84%
jan 1, 1998
572.906 mln
+15.709 mln
2.82%
jan 1, 1999
352.926 mln
-219.979 mln
-38.4%
jan 1, 2000
479.944 mln
+127.017 mln
35.99%
jan 1, 2001
847.13 mln
+367.186 mln
76.51%
jan 1, 2002
620.595 mln
-226.535 mln
-26.74%
jan 1, 2003
661.813 mln
+41.218 mln
6.64%
jan 1, 2004
746.308 mln
+84.495 mln
12.77%
jan 1, 2005
945.107 mln
+198.8 mln
26.64%
jan 1, 2006
1.239 bln
+293.673 mln
31.07%
jan 1, 2007
1.528 bln
+289.392 mln
23.36%
jan 1, 2008
1.632 bln
+104.202 mln
6.82%
jan 1, 2009
2.463 bln
+830.334 mln
50.87%
jan 1, 2010
1.224 bln
-1.239 bln
-50.32%
jan 1, 2011
1.383 bln
+159.297 mln
13.02%
jan 1, 2012
1.637 bln
+253.679 mln
18.34%
jan 1, 2013
1.696 bln
+59.75 mln
3.65%
jan 1, 2014
1.788 bln
+92.035 mln
5.43%
jan 1, 2015
1.739 bln
-49.689 mln
-2.78%
jan 1, 2016
0.0
-1.739 bln
-100.0%
Ranking of countries by current statistics by years


Comments: