29
/
en
AIzaSyAYiBZKx7MnpbEhh9jyipgxe19OcubqV5w
April 1, 2024
159112
Ireland
IRL
true
2
1
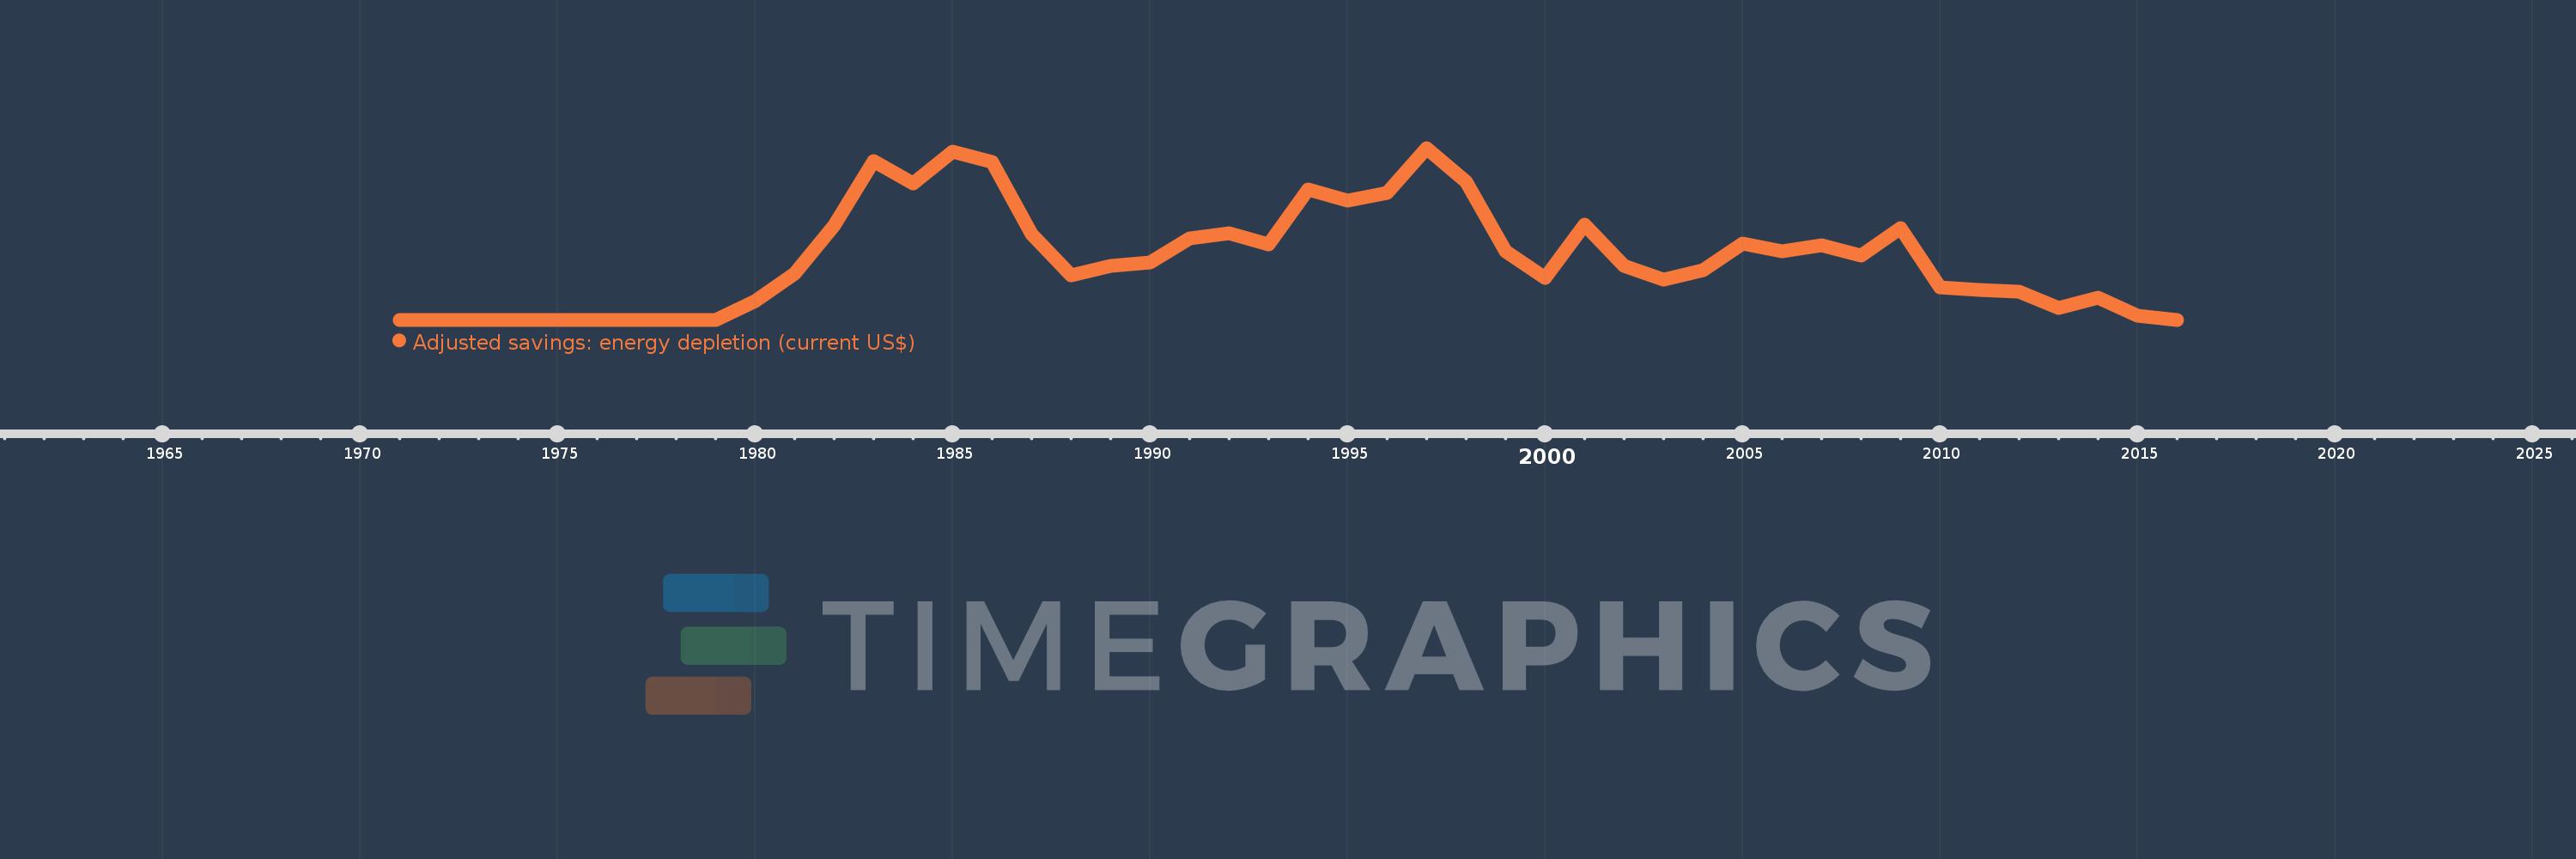
Adjusted savings: energy depletion (current US$)
2016,2015,2014,2013,2012,2011,2010,2009,2008,2007,2006,2005,2004,2003,2002,2001,2000,1999,1998,1997,1996,1995,1994,1993,1992,1991,1990,1989,1988,1987,1986,1985,1984,1983,1982,1981,1980,1979,1978,1977,1976,1975,1974,1973,1972,1971
This statistics in other country:
AfghanistanAlbaniaAlgeriaAmerican SamoaAndorraAngolaAntigua and BarbudaArgentinaArmeniaArubaAustraliaAustriaAzerbaijanBahamas, TheBahrainBangladeshBarbadosBelarusBelgiumBelizeBeninBermudaBhutanBoliviaBosnia and HerzegovinaBotswanaBrazilBrunei DarussalamBulgariaBurkina FasoBurundiCabo VerdeCambodiaCameroonCanadaCayman IslandsCentral African RepublicChadChannel IslandsChileChinaColombiaComorosCongo, Dem. Rep.Congo, Rep.Costa RicaCote d'IvoireCroatiaCubaCuracaoCyprusCzech RepublicDenmarkDjiboutiDominicaDominican RepublicEcuadorEgypt, Arab Rep.El SalvadorEquatorial GuineaEritreaEstoniaEthiopiaFaroe IslandsFijiFinlandFranceFrench PolynesiaGabonGambia, TheGeorgiaGermanyGhanaGibraltarGreeceGreenlandGrenadaGuamGuatemalaGuineaGuinea-BissauGuyanaHaitiHondurasHong Kong SAR, ChinaHungaryIcelandIndiaIndonesiaIran, Islamic Rep.IraqIrelandIsle of ManIsraelItalyJamaicaJapanJordanKazakhstanKenyaKiribatiKorea, Dem. People’s Rep.Korea, Rep.KosovoKuwaitKyrgyz RepublicLao PDRLatviaLebanonLesothoLiberiaLibyaLiechtensteinLithuaniaLuxembourgMacao SAR, ChinaMacedonia, FYRMadagascarMalawiMalaysiaMaldivesMaliMaltaMarshall IslandsMauritaniaMauritiusMexicoMicronesia, Fed. Sts.MoldovaMonacoMongoliaMontenegroMoroccoMozambiqueMyanmarNamibiaNepalNetherlandsNew CaledoniaNew ZealandNicaraguaNigerNigeriaNorthern Mariana IslandsNorwayOmanPakistanPalauPanamaPapua New GuineaParaguayPeruPhilippinesPolandPortugalPuerto RicoQatarRomaniaRussian FederationRwandaSamoaSan MarinoSao Tome and PrincipeSaudi ArabiaSenegalSerbiaSeychellesSierra LeoneSingaporeSint Maarten (Dutch part)Slovak RepublicSloveniaSolomon IslandsSomaliaSouth AfricaSouth SudanSpainSri LankaSt. Kitts and NevisSt. LuciaSt. Martin (French part)St. Vincent and the GrenadinesSudanSurinameSwazilandSwedenSwitzerlandSyrian Arab RepublicTajikistanTanzaniaThailandTimor-LesteTogoTongaTrinidad and TobagoTunisiaTurkeyTurkmenistanTurks and Caicos IslandsTuvaluUgandaUkraineUnited Arab EmiratesUnited KingdomUnited StatesUruguayUzbekistanVanuatuVenezuela, RBVietnamVirgin Islands (U.S.)West Bank and GazaYemen, Rep.ZambiaZimbabwe Timeline:
This timeline shows a graph from 1971 to 2016 of Ireland. No data until 1970. Number of actual observations by date: 46.
Source name:
World Development Indicators
Source organization:
World Bank staff estimates based on sources and methods in World Bank's "The Changing Wealth of Nations: Measuring Sustainable Development in the New Millennium" (2011).
Categories, topics:
Economy & Growth, Energy & Mining, Environment
Last updated:
apr 23, 2017
Indicators value changes by year
Maximum:
175.67 mln
jan 1, 1997
At the date of observation
Value
Absolute change
Change from previous value
jan 1, 1976
140.992K
+140.992K
%
jan 1, 1977
136.022K
-4.97K
-3.53%
jan 1, 1978
114.629K
-21.392K
-15.73%
jan 1, 1979
5.018K
-109.611K
-95.62%
jan 1, 1980
18.705 mln
+18.7 mln
372.66K%
jan 1, 1981
47.203 mln
+28.498 mln
152.36%
jan 1, 1982
95.998 mln
+48.795 mln
103.37%
jan 1, 1983
161.992 mln
+65.994 mln
68.75%
jan 1, 1984
139.39 mln
-22.602 mln
-13.95%
jan 1, 1985
172.128 mln
+32.738 mln
23.49%
jan 1, 1986
161.065 mln
-11.063 mln
-6.43%
jan 1, 1987
88.006 mln
-73.059 mln
-45.36%
jan 1, 1988
45.73 mln
-42.276 mln
-48.04%
jan 1, 1989
54.8 mln
+9.07 mln
19.83%
jan 1, 1990
58.85 mln
+4.05 mln
7.39%
jan 1, 1991
83.534 mln
+24.684 mln
41.94%
jan 1, 1992
88.317 mln
+4.783 mln
5.73%
jan 1, 1993
76.656 mln
-11.661 mln
-13.2%
jan 1, 1994
133.192 mln
+56.536 mln
73.75%
jan 1, 1995
121.468 mln
-11.723 mln
-8.8%
jan 1, 1996
129.573 mln
+8.105 mln
6.67%
jan 1, 1997
175.67 mln
+46.097 mln
35.58%
jan 1, 1998
141.342 mln
-34.328 mln
-19.54%
jan 1, 1999
69.72 mln
-71.622 mln
-50.67%
jan 1, 2000
43.143 mln
-26.577 mln
-38.12%
jan 1, 2001
97.077 mln
+53.934 mln
125.01%
jan 1, 2002
55.309 mln
-41.768 mln
-43.03%
jan 1, 2003
41.111 mln
-14.198 mln
-25.67%
jan 1, 2004
50.98 mln
+9.869 mln
24.0%
jan 1, 2005
77.921 mln
+26.941 mln
52.85%
jan 1, 2006
70.182 mln
-7.739 mln
-9.93%
jan 1, 2007
76.229 mln
+6.047 mln
8.62%
jan 1, 2008
65.797 mln
-10.432 mln
-13.68%
jan 1, 2009
93.351 mln
+27.554 mln
41.88%
jan 1, 2010
33.044 mln
-60.308 mln
-64.6%
jan 1, 2011
30.391 mln
-2.653 mln
-8.03%
jan 1, 2012
28.762 mln
-1.629 mln
-5.36%
jan 1, 2013
11.759 mln
-17.003 mln
-59.12%
jan 1, 2014
22.136 mln
+10.377 mln
88.24%
jan 1, 2015
3.999 mln
-18.137 mln
-81.93%
jan 1, 2016
0.0
-3.999 mln
-100.0%
Ranking of countries by current statistics by years


Comments: