29
/
en
AIzaSyAYiBZKx7MnpbEhh9jyipgxe19OcubqV5w
April 1, 2024
278447
Uzbekistan
UZB
true
2
1
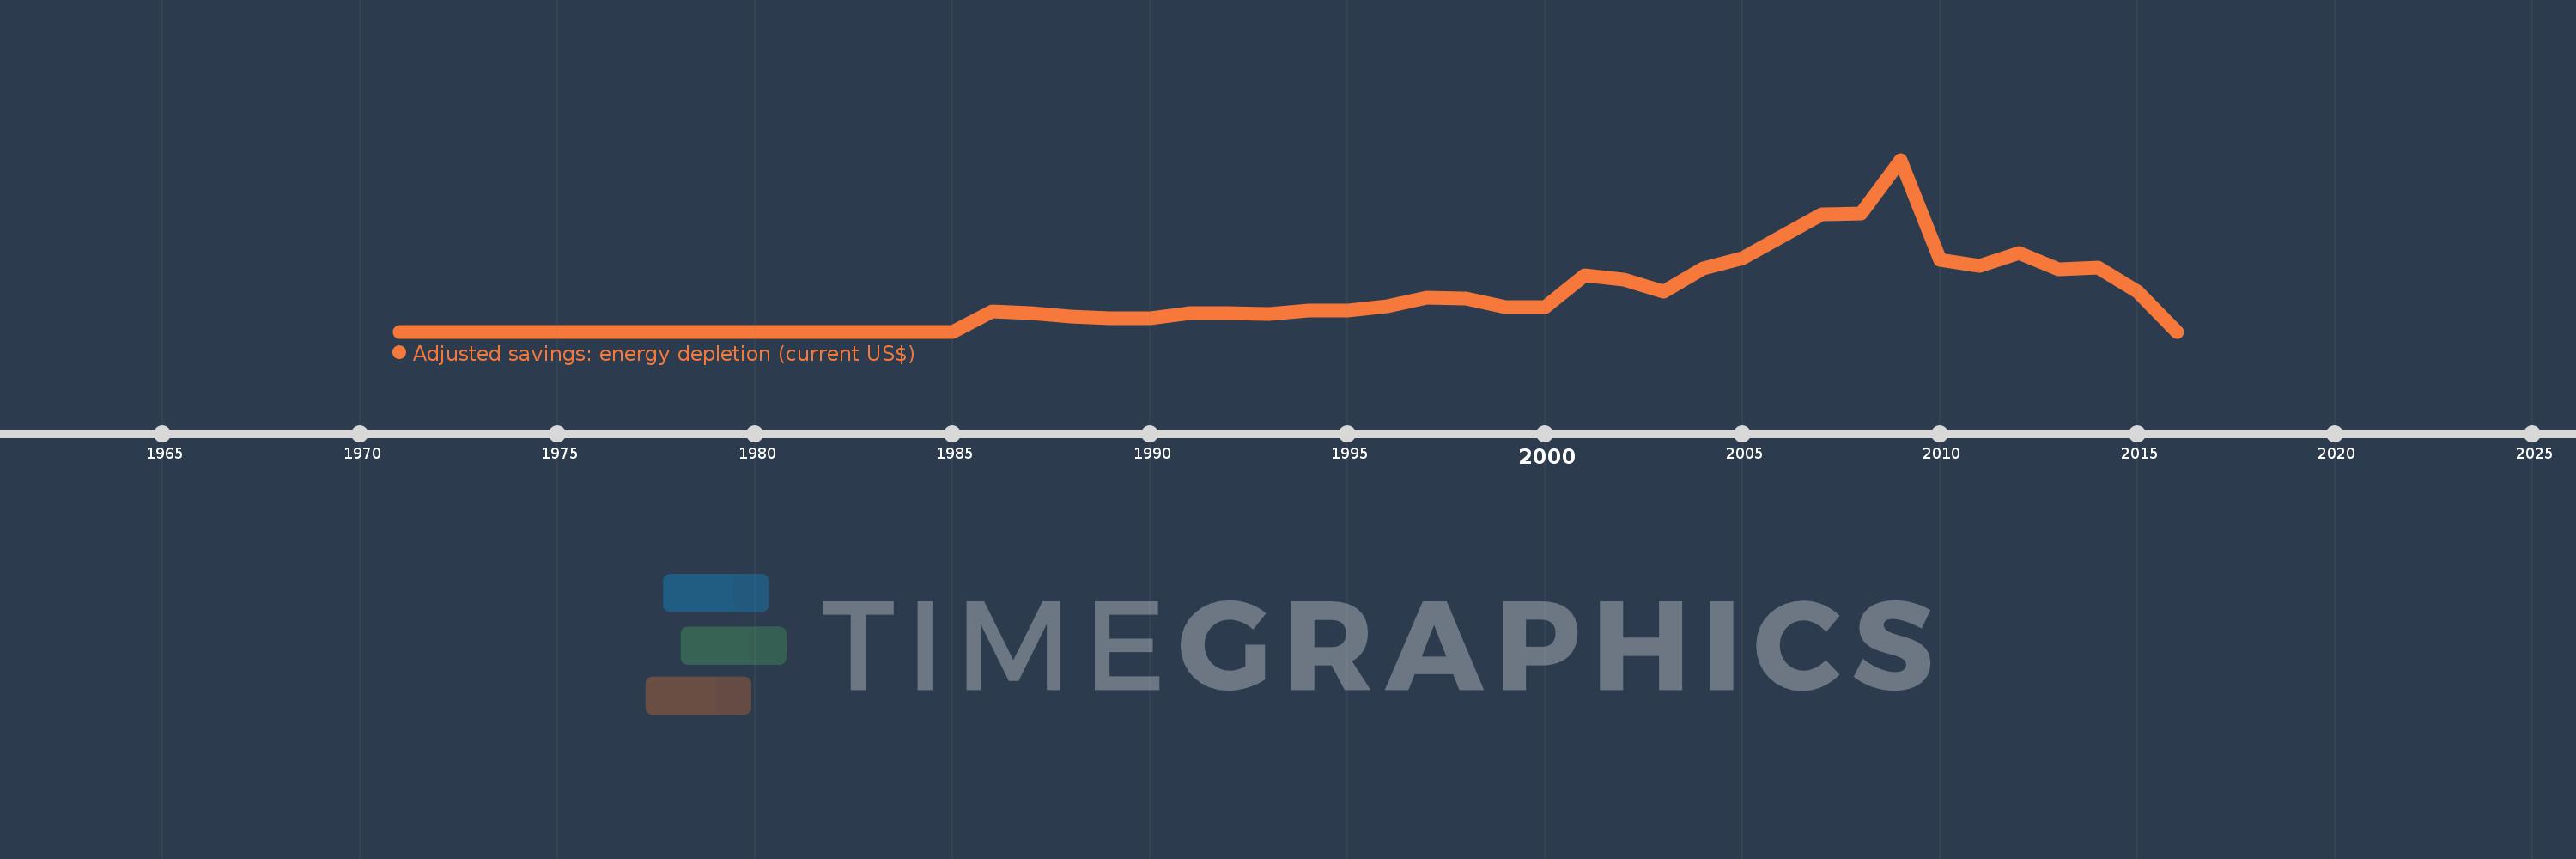
Adjusted savings: energy depletion (current US$)
2016,2015,2014,2013,2012,2011,2010,2009,2008,2007,2005,2004,2003,2002,2001,2000,1999,1998,1997,1996,1995,1994,1993,1992,1991,1990,1989,1988,1987,1986,1985,1984,1983,1982,1981,1980,1979,1978,1977,1976,1975,1974,1973,1972,1971
This statistics in other country:
AfghanistanAlbaniaAlgeriaAmerican SamoaAndorraAngolaAntigua and BarbudaArgentinaArmeniaArubaAustraliaAustriaAzerbaijanBahamas, TheBahrainBangladeshBarbadosBelarusBelgiumBelizeBeninBermudaBhutanBoliviaBosnia and HerzegovinaBotswanaBrazilBrunei DarussalamBulgariaBurkina FasoBurundiCabo VerdeCambodiaCameroonCanadaCayman IslandsCentral African RepublicChadChannel IslandsChileChinaColombiaComorosCongo, Dem. Rep.Congo, Rep.Costa RicaCote d'IvoireCroatiaCubaCuracaoCyprusCzech RepublicDenmarkDjiboutiDominicaDominican RepublicEcuadorEgypt, Arab Rep.El SalvadorEquatorial GuineaEritreaEstoniaEthiopiaFaroe IslandsFijiFinlandFranceFrench PolynesiaGabonGambia, TheGeorgiaGermanyGhanaGibraltarGreeceGreenlandGrenadaGuamGuatemalaGuineaGuinea-BissauGuyanaHaitiHondurasHong Kong SAR, ChinaHungaryIcelandIndiaIndonesiaIran, Islamic Rep.IraqIrelandIsle of ManIsraelItalyJamaicaJapanJordanKazakhstanKenyaKiribatiKorea, Dem. People’s Rep.Korea, Rep.KosovoKuwaitKyrgyz RepublicLao PDRLatviaLebanonLesothoLiberiaLibyaLiechtensteinLithuaniaLuxembourgMacao SAR, ChinaMacedonia, FYRMadagascarMalawiMalaysiaMaldivesMaliMaltaMarshall IslandsMauritaniaMauritiusMexicoMicronesia, Fed. Sts.MoldovaMonacoMongoliaMontenegroMoroccoMozambiqueMyanmarNamibiaNepalNetherlandsNew CaledoniaNew ZealandNicaraguaNigerNigeriaNorthern Mariana IslandsNorwayOmanPakistanPalauPanamaPapua New GuineaParaguayPeruPhilippinesPolandPortugalPuerto RicoQatarRomaniaRussian FederationRwandaSamoaSan MarinoSao Tome and PrincipeSaudi ArabiaSenegalSerbiaSeychellesSierra LeoneSingaporeSint Maarten (Dutch part)Slovak RepublicSloveniaSolomon IslandsSomaliaSouth AfricaSouth SudanSpainSri LankaSt. Kitts and NevisSt. LuciaSt. Martin (French part)St. Vincent and the GrenadinesSudanSurinameSwazilandSwedenSwitzerlandSyrian Arab RepublicTajikistanTanzaniaThailandTimor-LesteTogoTongaTrinidad and TobagoTunisiaTurkeyTurkmenistanTurks and Caicos IslandsTuvaluUgandaUkraineUnited Arab EmiratesUnited KingdomUnited StatesUruguayUzbekistanVanuatuVenezuela, RBVietnamVirgin Islands (U.S.)West Bank and GazaYemen, Rep.ZambiaZimbabwe Timeline:
This timeline shows a graph from 1971 to 2016 of Uzbekistan. No data until 1970. Number of actual observations by date: 45.
Source name:
World Development Indicators
Source organization:
World Bank staff estimates based on sources and methods in World Bank's "The Changing Wealth of Nations: Measuring Sustainable Development in the New Millennium" (2011).
Categories, topics:
Economy & Growth, Energy & Mining, Environment
Last updated:
apr 23, 2017
Indicators value changes by year
Maximum:
14.877 bln
jan 1, 2009
At the date of observation
Value
Absolute change
Change from previous value
jan 1, 1986
1.765 bln
+1.765 bln
%
jan 1, 1987
1.626 bln
-138.847 mln
-7.87%
jan 1, 1988
1.315 bln
-311.603 mln
-19.16%
jan 1, 1989
1.135 bln
-179.633 mln
-13.67%
jan 1, 1990
1.154 bln
+19.334 mln
1.7%
jan 1, 1991
1.588 bln
+434.108 mln
37.61%
jan 1, 1992
1.562 bln
-26.148 mln
-1.65%
jan 1, 1993
1.492 bln
-69.885 mln
-4.47%
jan 1, 1994
1.843 bln
+350.977 mln
23.52%
jan 1, 1995
1.859 bln
+15.318 mln
0.83%
jan 1, 1996
2.224 bln
+365.324 mln
19.66%
jan 1, 1997
2.907 bln
+683.048 mln
30.71%
jan 1, 1998
2.831 bln
-76.187 mln
-2.62%
jan 1, 1999
2.14 bln
-690.957 mln
-24.41%
jan 1, 2000
2.126 bln
-13.842 mln
-0.65%
jan 1, 2001
4.87 bln
+2.744 bln
129.08%
jan 1, 2002
4.501 bln
-369.024 mln
-7.58%
jan 1, 2003
3.463 bln
-1.038 bln
-23.07%
jan 1, 2004
5.448 bln
+1.985 bln
57.31%
jan 1, 2005
6.374 bln
+926.493 mln
17.01%
jan 1, 2007
10.124 bln
+3.749 bln
58.82%
jan 1, 2008
10.232 bln
+108.825 mln
1.07%
jan 1, 2009
14.877 bln
+4.645 bln
45.39%
jan 1, 2010
6.238 bln
-8.639 bln
-58.07%
jan 1, 2011
5.723 bln
-515.175 mln
-8.26%
jan 1, 2012
6.809 bln
+1.086 bln
18.98%
jan 1, 2013
5.424 bln
-1.385 bln
-20.34%
jan 1, 2014
5.532 bln
+108.112 mln
1.99%
jan 1, 2015
3.491 bln
-2.041 bln
-36.89%
jan 1, 2016
0.0
-3.491 bln
-100.0%
Ranking of countries by current statistics by years


Comments: