29
/
en
AIzaSyAYiBZKx7MnpbEhh9jyipgxe19OcubqV5w
April 1, 2024
124410
Egypt, Arab Rep.
EGY
true
2
1
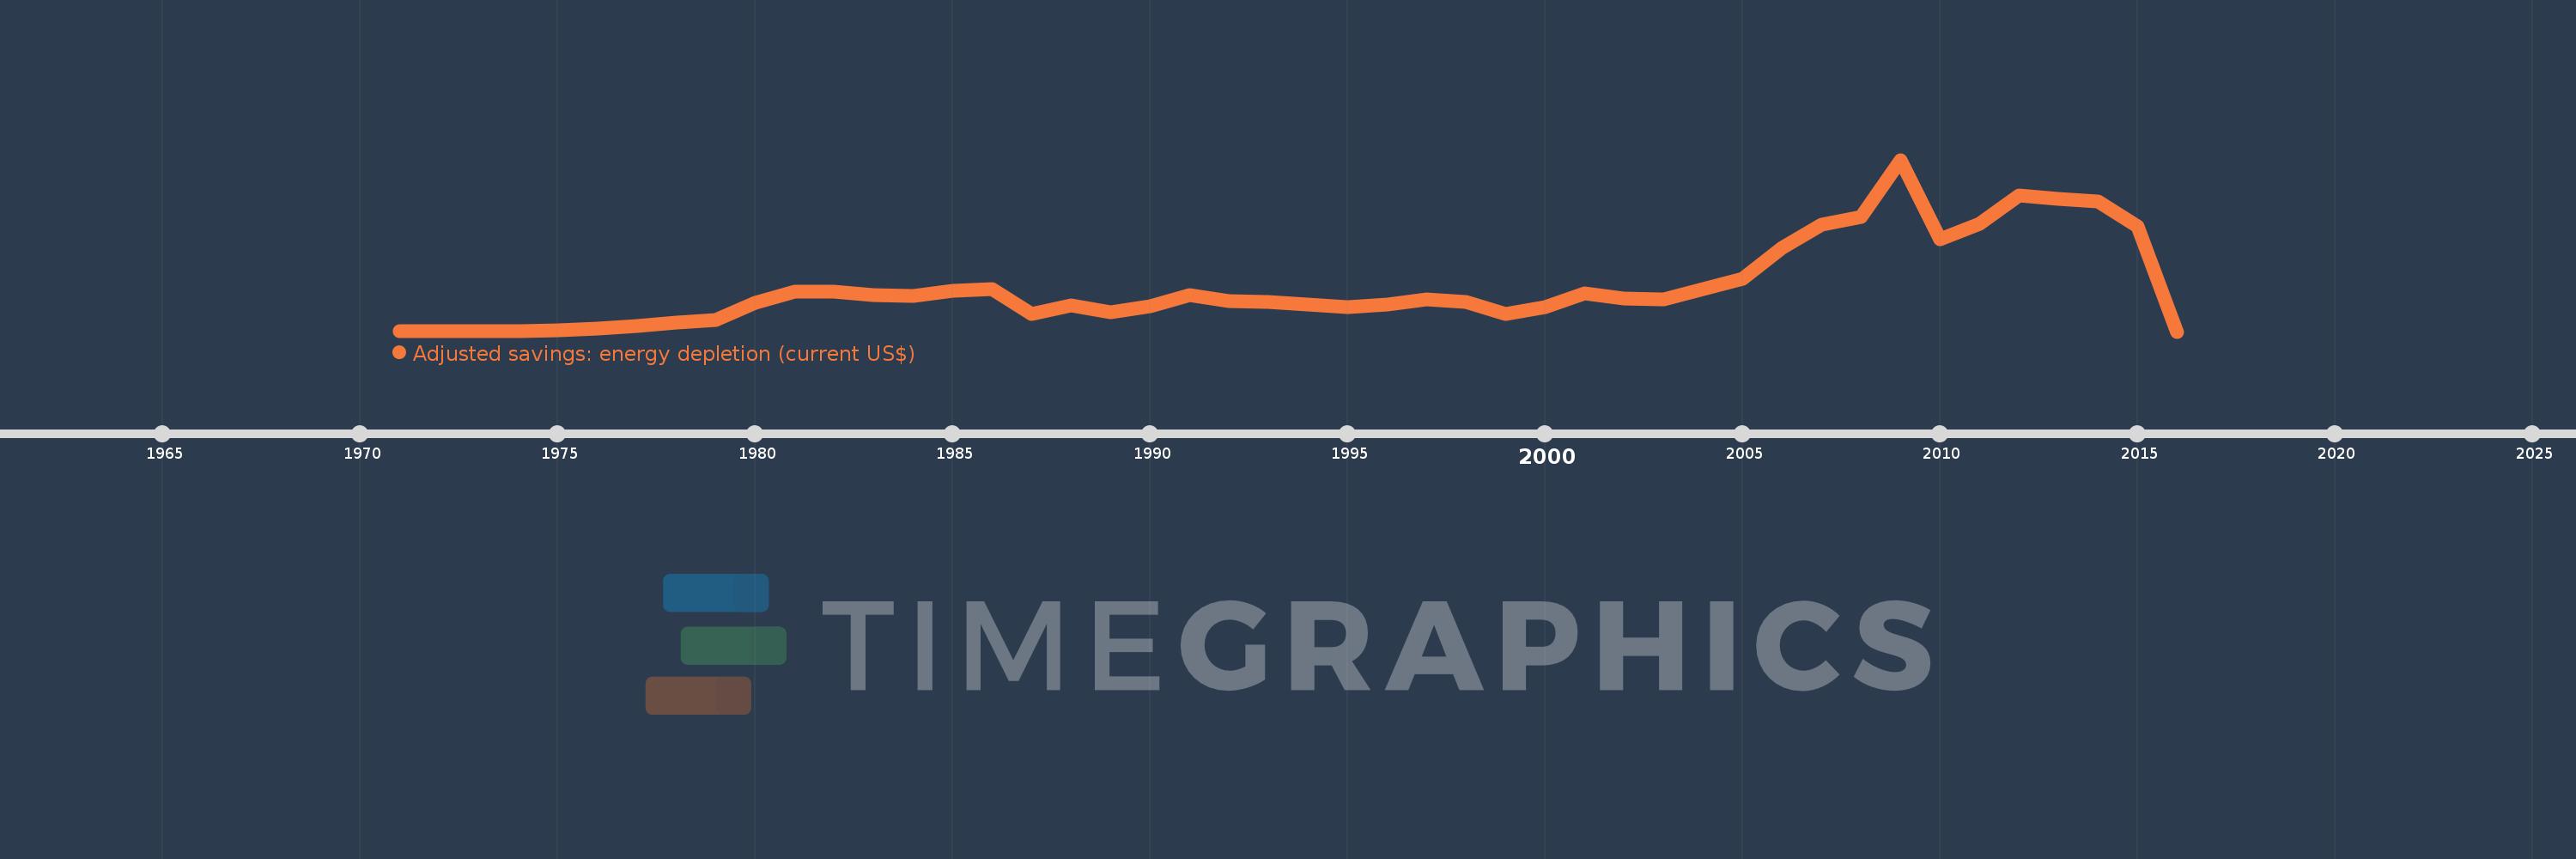
Adjusted savings: energy depletion (current US$)
2016,2015,2014,2013,2012,2011,2010,2009,2008,2007,2006,2005,2004,2003,2002,2001,2000,1999,1998,1997,1996,1995,1994,1993,1992,1991,1990,1989,1988,1987,1986,1985,1984,1983,1982,1981,1980,1979,1978,1977,1976,1975,1974,1973,1972,1971
This statistics in other country:
AfghanistanAlbaniaAlgeriaAmerican SamoaAndorraAngolaAntigua and BarbudaArgentinaArmeniaArubaAustraliaAustriaAzerbaijanBahamas, TheBahrainBangladeshBarbadosBelarusBelgiumBelizeBeninBermudaBhutanBoliviaBosnia and HerzegovinaBotswanaBrazilBrunei DarussalamBulgariaBurkina FasoBurundiCabo VerdeCambodiaCameroonCanadaCayman IslandsCentral African RepublicChadChannel IslandsChileChinaColombiaComorosCongo, Dem. Rep.Congo, Rep.Costa RicaCote d'IvoireCroatiaCubaCuracaoCyprusCzech RepublicDenmarkDjiboutiDominicaDominican RepublicEcuadorEgypt, Arab Rep.El SalvadorEquatorial GuineaEritreaEstoniaEthiopiaFaroe IslandsFijiFinlandFranceFrench PolynesiaGabonGambia, TheGeorgiaGermanyGhanaGibraltarGreeceGreenlandGrenadaGuamGuatemalaGuineaGuinea-BissauGuyanaHaitiHondurasHong Kong SAR, ChinaHungaryIcelandIndiaIndonesiaIran, Islamic Rep.IraqIrelandIsle of ManIsraelItalyJamaicaJapanJordanKazakhstanKenyaKiribatiKorea, Dem. People’s Rep.Korea, Rep.KosovoKuwaitKyrgyz RepublicLao PDRLatviaLebanonLesothoLiberiaLibyaLiechtensteinLithuaniaLuxembourgMacao SAR, ChinaMacedonia, FYRMadagascarMalawiMalaysiaMaldivesMaliMaltaMarshall IslandsMauritaniaMauritiusMexicoMicronesia, Fed. Sts.MoldovaMonacoMongoliaMontenegroMoroccoMozambiqueMyanmarNamibiaNepalNetherlandsNew CaledoniaNew ZealandNicaraguaNigerNigeriaNorthern Mariana IslandsNorwayOmanPakistanPalauPanamaPapua New GuineaParaguayPeruPhilippinesPolandPortugalPuerto RicoQatarRomaniaRussian FederationRwandaSamoaSan MarinoSao Tome and PrincipeSaudi ArabiaSenegalSerbiaSeychellesSierra LeoneSingaporeSint Maarten (Dutch part)Slovak RepublicSloveniaSolomon IslandsSomaliaSouth AfricaSouth SudanSpainSri LankaSt. Kitts and NevisSt. LuciaSt. Martin (French part)St. Vincent and the GrenadinesSudanSurinameSwazilandSwedenSwitzerlandSyrian Arab RepublicTajikistanTanzaniaThailandTimor-LesteTogoTongaTrinidad and TobagoTunisiaTurkeyTurkmenistanTurks and Caicos IslandsTuvaluUgandaUkraineUnited Arab EmiratesUnited KingdomUnited StatesUruguayUzbekistanVanuatuVenezuela, RBVietnamVirgin Islands (U.S.)West Bank and GazaYemen, Rep.ZambiaZimbabwe Timeline:
This timeline shows a graph from 1971 to 2016 of Egypt, Arab Rep.. No data until 1970. Number of actual observations by date: 46.
Source name:
World Development Indicators
Source organization:
World Bank staff estimates based on sources and methods in World Bank's "The Changing Wealth of Nations: Measuring Sustainable Development in the New Millennium" (2011).
Categories, topics:
Economy & Growth, Energy & Mining, Environment
Last updated:
apr 23, 2017
Indicators value changes by year
Maximum:
25.963 bln
jan 1, 2009
At the date of observation
Value
Absolute change
Change from previous value
jan 1, 1971
80.249 mln
+80.249 mln
0.0%
jan 1, 1972
105.869 mln
+25.62 mln
31.93%
jan 1, 1973
69.258 mln
-36.611 mln
-34.58%
jan 1, 1974
75.254 mln
+5.996 mln
8.66%
jan 1, 1975
258.567 mln
+183.313 mln
243.59%
jan 1, 1976
481.888 mln
+223.322 mln
86.37%
jan 1, 1977
896.485 mln
+414.596 mln
86.04%
jan 1, 1978
1.303 bln
+406.806 mln
45.38%
jan 1, 1979
1.73 bln
+426.615 mln
32.73%
jan 1, 1980
4.382 bln
+2.652 bln
153.33%
jan 1, 1981
6.055 bln
+1.673 bln
38.17%
jan 1, 1982
5.981 bln
-73.451 mln
-1.21%
jan 1, 1983
5.53 bln
-451.174 mln
-7.54%
jan 1, 1984
5.365 bln
-165.026 mln
-2.98%
jan 1, 1985
6.13 bln
+765.18 mln
14.26%
jan 1, 1986
6.389 bln
+258.987 mln
4.22%
jan 1, 1987
2.626 bln
-3.763 bln
-58.9%
jan 1, 1988
3.966 bln
+1.341 bln
51.05%
jan 1, 1989
2.981 bln
-985.129 mln
-24.84%
jan 1, 1990
3.788 bln
+807.037 mln
27.07%
jan 1, 1991
5.53 bln
+1.742 bln
45.98%
jan 1, 1992
4.597 bln
-933.381 mln
-16.88%
jan 1, 1993
4.476 bln
-121.478 mln
-2.64%
jan 1, 1994
4.133 bln
-342.958 mln
-7.66%
jan 1, 1995
3.732 bln
-400.541 mln
-9.69%
jan 1, 1996
4.087 bln
+355.185 mln
9.52%
jan 1, 1997
4.84 bln
+752.83 mln
18.42%
jan 1, 1998
4.448 bln
-391.927 mln
-8.1%
jan 1, 1999
2.653 bln
-1.795 bln
-40.35%
jan 1, 2000
3.641 bln
+987.777 mln
37.23%
jan 1, 2001
5.794 bln
+2.153 bln
59.12%
jan 1, 2002
4.959 bln
-834.678 mln
-14.41%
jan 1, 2003
4.828 bln
-130.694 mln
-2.64%
jan 1, 2004
6.487 bln
+1.659 bln
34.35%
jan 1, 2005
7.958 bln
+1.471 bln
22.68%
jan 1, 2006
12.717 bln
+4.759 bln
59.81%
jan 1, 2007
16.122 bln
+3.405 bln
26.77%
jan 1, 2008
17.283 bln
+1.161 bln
7.2%
jan 1, 2009
25.963 bln
+8.681 bln
50.23%
jan 1, 2010
13.97 bln
-11.994 bln
-46.19%
jan 1, 2011
16.324 bln
+2.354 bln
16.85%
jan 1, 2012
20.525 bln
+4.201 bln
25.74%
jan 1, 2013
19.996 bln
-528.946 mln
-2.58%
jan 1, 2014
19.625 bln
-371.428 mln
-1.86%
jan 1, 2015
15.905 bln
-3.72 bln
-18.96%
jan 1, 2016
0.0
-15.905 bln
-100.0%
Ranking of countries by current statistics by years


Comments: