29
/
en
AIzaSyAYiBZKx7MnpbEhh9jyipgxe19OcubqV5w
April 1, 2024
187416
Malaysia
MYS
true
2
1
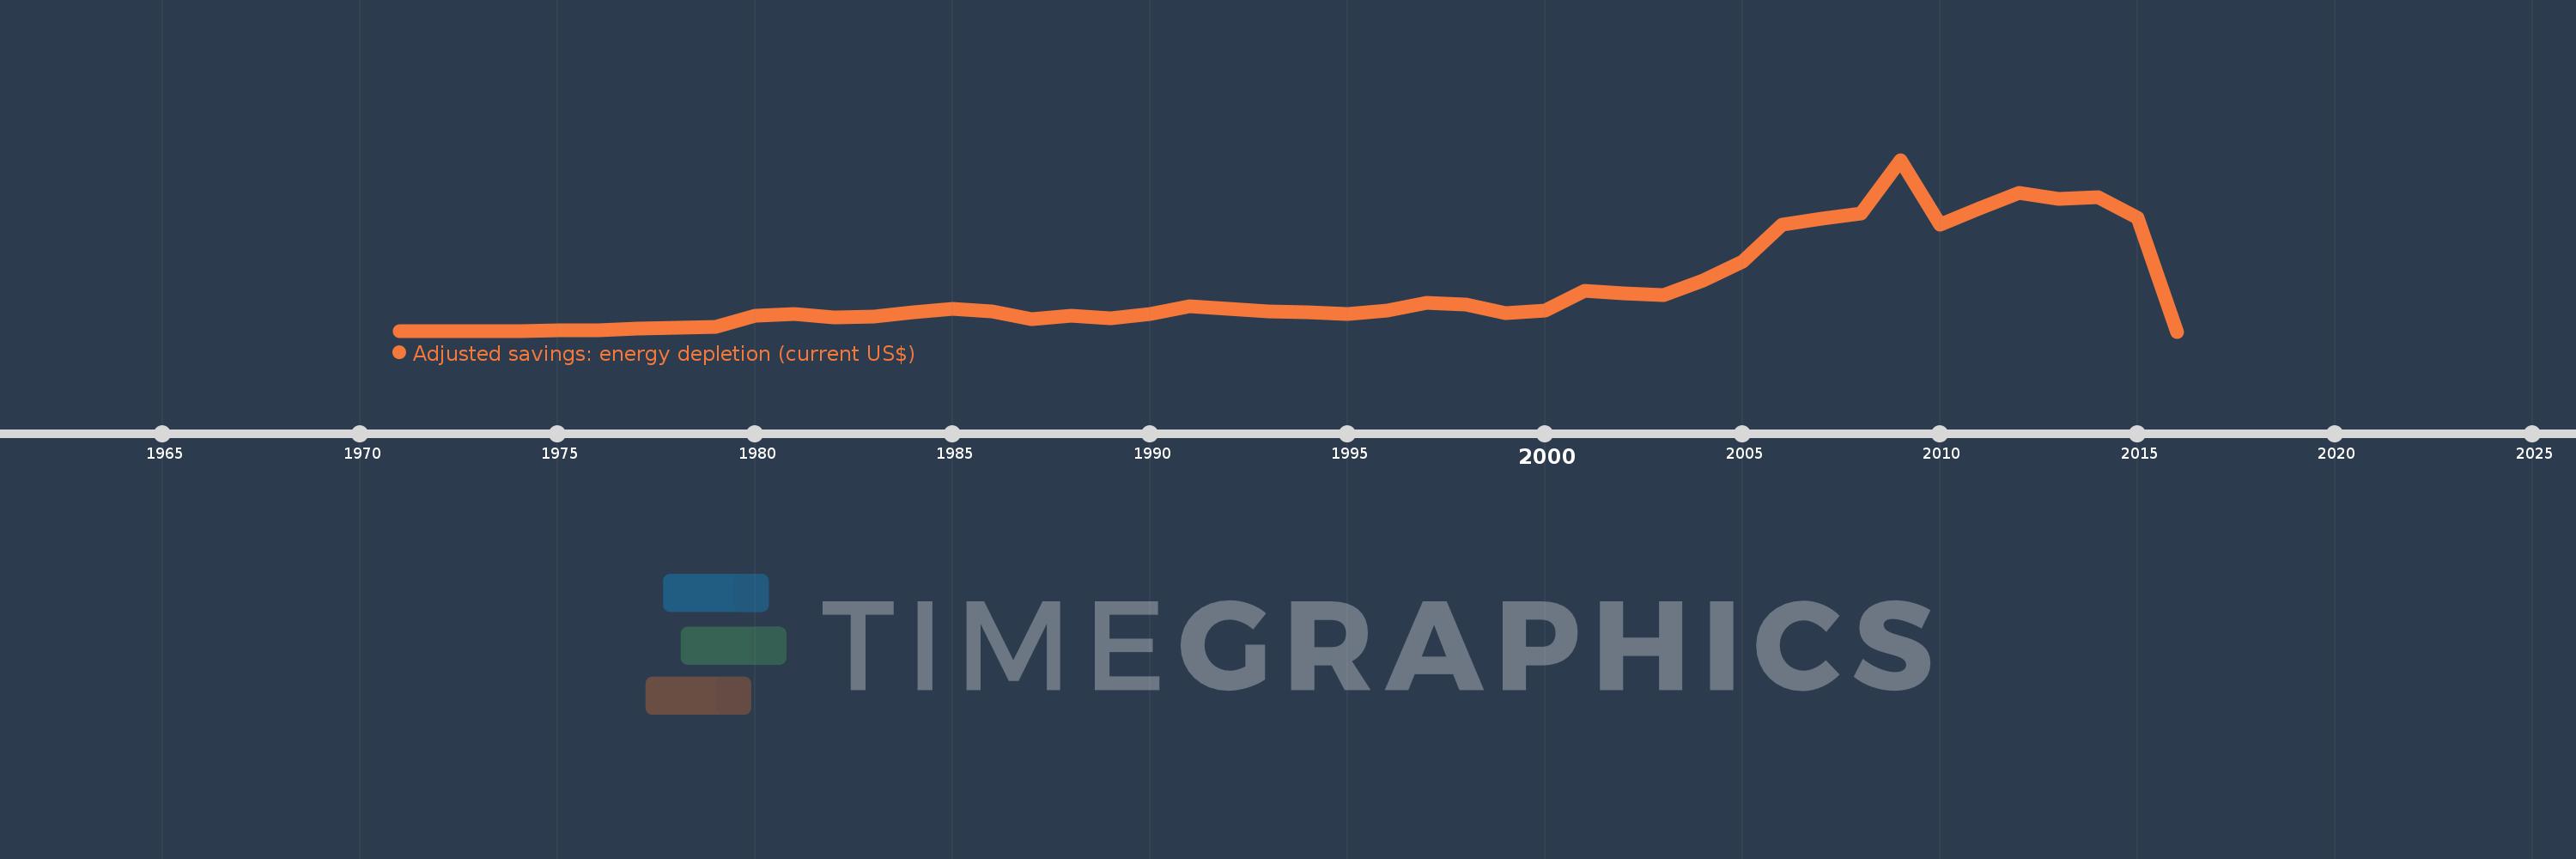
Adjusted savings: energy depletion (current US$)
2016,2015,2014,2013,2012,2011,2010,2009,2008,2007,2006,2005,2004,2003,2002,2001,2000,1999,1998,1997,1996,1995,1994,1993,1992,1991,1990,1989,1988,1987,1986,1985,1984,1983,1982,1981,1980,1979,1978,1977,1976,1975,1974,1973,1972,1971
This statistics in other country:
AfghanistanAlbaniaAlgeriaAmerican SamoaAndorraAngolaAntigua and BarbudaArgentinaArmeniaArubaAustraliaAustriaAzerbaijanBahamas, TheBahrainBangladeshBarbadosBelarusBelgiumBelizeBeninBermudaBhutanBoliviaBosnia and HerzegovinaBotswanaBrazilBrunei DarussalamBulgariaBurkina FasoBurundiCabo VerdeCambodiaCameroonCanadaCayman IslandsCentral African RepublicChadChannel IslandsChileChinaColombiaComorosCongo, Dem. Rep.Congo, Rep.Costa RicaCote d'IvoireCroatiaCubaCuracaoCyprusCzech RepublicDenmarkDjiboutiDominicaDominican RepublicEcuadorEgypt, Arab Rep.El SalvadorEquatorial GuineaEritreaEstoniaEthiopiaFaroe IslandsFijiFinlandFranceFrench PolynesiaGabonGambia, TheGeorgiaGermanyGhanaGibraltarGreeceGreenlandGrenadaGuamGuatemalaGuineaGuinea-BissauGuyanaHaitiHondurasHong Kong SAR, ChinaHungaryIcelandIndiaIndonesiaIran, Islamic Rep.IraqIrelandIsle of ManIsraelItalyJamaicaJapanJordanKazakhstanKenyaKiribatiKorea, Dem. People’s Rep.Korea, Rep.KosovoKuwaitKyrgyz RepublicLao PDRLatviaLebanonLesothoLiberiaLibyaLiechtensteinLithuaniaLuxembourgMacao SAR, ChinaMacedonia, FYRMadagascarMalawiMalaysiaMaldivesMaliMaltaMarshall IslandsMauritaniaMauritiusMexicoMicronesia, Fed. Sts.MoldovaMonacoMongoliaMontenegroMoroccoMozambiqueMyanmarNamibiaNepalNetherlandsNew CaledoniaNew ZealandNicaraguaNigerNigeriaNorthern Mariana IslandsNorwayOmanPakistanPalauPanamaPapua New GuineaParaguayPeruPhilippinesPolandPortugalPuerto RicoQatarRomaniaRussian FederationRwandaSamoaSan MarinoSao Tome and PrincipeSaudi ArabiaSenegalSerbiaSeychellesSierra LeoneSingaporeSint Maarten (Dutch part)Slovak RepublicSloveniaSolomon IslandsSomaliaSouth AfricaSouth SudanSpainSri LankaSt. Kitts and NevisSt. LuciaSt. Martin (French part)St. Vincent and the GrenadinesSudanSurinameSwazilandSwedenSwitzerlandSyrian Arab RepublicTajikistanTanzaniaThailandTimor-LesteTogoTongaTrinidad and TobagoTunisiaTurkeyTurkmenistanTurks and Caicos IslandsTuvaluUgandaUkraineUnited Arab EmiratesUnited KingdomUnited StatesUruguayUzbekistanVanuatuVenezuela, RBVietnamVirgin Islands (U.S.)West Bank and GazaYemen, Rep.ZambiaZimbabwe Timeline:
This timeline shows a graph from 1971 to 2016 of Malaysia. No data until 1970. Number of actual observations by date: 46.
Source name:
World Development Indicators
Source organization:
World Bank staff estimates based on sources and methods in World Bank's "The Changing Wealth of Nations: Measuring Sustainable Development in the New Millennium" (2011).
Categories, topics:
Economy & Growth, Energy & Mining, Environment
Last updated:
apr 23, 2017
Indicators value changes by year
Maximum:
26.39 bln
jan 1, 2009
At the date of observation
Value
Absolute change
Change from previous value
jan 1, 1971
3.975 mln
+3.975 mln
0.0%
jan 1, 1972
17.834 mln
+13.859 mln
348.7%
jan 1, 1973
26.408 mln
+8.574 mln
48.08%
jan 1, 1974
40.23 mln
+13.822 mln
52.34%
jan 1, 1975
144.987 mln
+104.758 mln
260.4%
jan 1, 1976
178.613 mln
+33.626 mln
23.19%
jan 1, 1977
433.066 mln
+254.453 mln
142.46%
jan 1, 1978
548.583 mln
+115.516 mln
26.67%
jan 1, 1979
750.676 mln
+202.093 mln
36.84%
jan 1, 1980
2.494 bln
+1.743 bln
232.17%
jan 1, 1981
2.765 bln
+271.65 mln
10.89%
jan 1, 1982
2.158 bln
-607.469 mln
-21.97%
jan 1, 1983
2.361 bln
+202.872 mln
9.4%
jan 1, 1984
2.977 bln
+616.498 mln
26.12%
jan 1, 1985
3.478 bln
+500.732 mln
16.82%
jan 1, 1986
3.072 bln
-405.676 mln
-11.66%
jan 1, 1987
1.963 bln
-1.109 bln
-36.1%
jan 1, 1988
2.377 bln
+414.353 mln
21.11%
jan 1, 1989
2.085 bln
-292.06 mln
-12.29%
jan 1, 1990
2.665 bln
+579.619 mln
27.8%
jan 1, 1991
3.881 bln
+1.216 bln
45.62%
jan 1, 1992
3.468 bln
-412.621 mln
-10.63%
jan 1, 1993
3.093 bln
-374.613 mln
-10.8%
jan 1, 1994
2.915 bln
-178.431 mln
-5.77%
jan 1, 1995
2.72 bln
-195.128 mln
-6.69%
jan 1, 1996
3.224 bln
+504.049 mln
18.53%
jan 1, 1997
4.451 bln
+1.227 bln
38.07%
jan 1, 1998
4.212 bln
-238.783 mln
-5.36%
jan 1, 1999
2.846 bln
-1.367 bln
-32.44%
jan 1, 2000
3.233 bln
+387.134 mln
13.6%
jan 1, 2001
6.307 bln
+3.074 bln
95.09%
jan 1, 2002
5.841 bln
-466.503 mln
-7.4%
jan 1, 2003
5.634 bln
-206.369 mln
-3.53%
jan 1, 2004
7.885 bln
+2.25 bln
39.94%
jan 1, 2005
10.711 bln
+2.826 bln
35.85%
jan 1, 2006
16.486 bln
+5.774 bln
53.91%
jan 1, 2007
17.327 bln
+841.187 mln
5.1%
jan 1, 2008
18.186 bln
+859.407 mln
4.96%
jan 1, 2009
26.39 bln
+8.203 bln
45.11%
jan 1, 2010
16.391 bln
-9.998 bln
-37.89%
jan 1, 2011
18.87 bln
+2.478 bln
15.12%
jan 1, 2012
21.276 bln
+2.407 bln
12.75%
jan 1, 2013
20.334 bln
-942.279 mln
-4.43%
jan 1, 2014
20.643 bln
+308.813 mln
1.52%
jan 1, 2015
17.489 bln
-3.154 bln
-15.28%
jan 1, 2016
0.0
-17.489 bln
-100.0%
Ranking of countries by current statistics by years


Comments: