29
/
en
AIzaSyAYiBZKx7MnpbEhh9jyipgxe19OcubqV5w
April 1, 2024
274498
United Arab Emirates
ARE
true
2
1
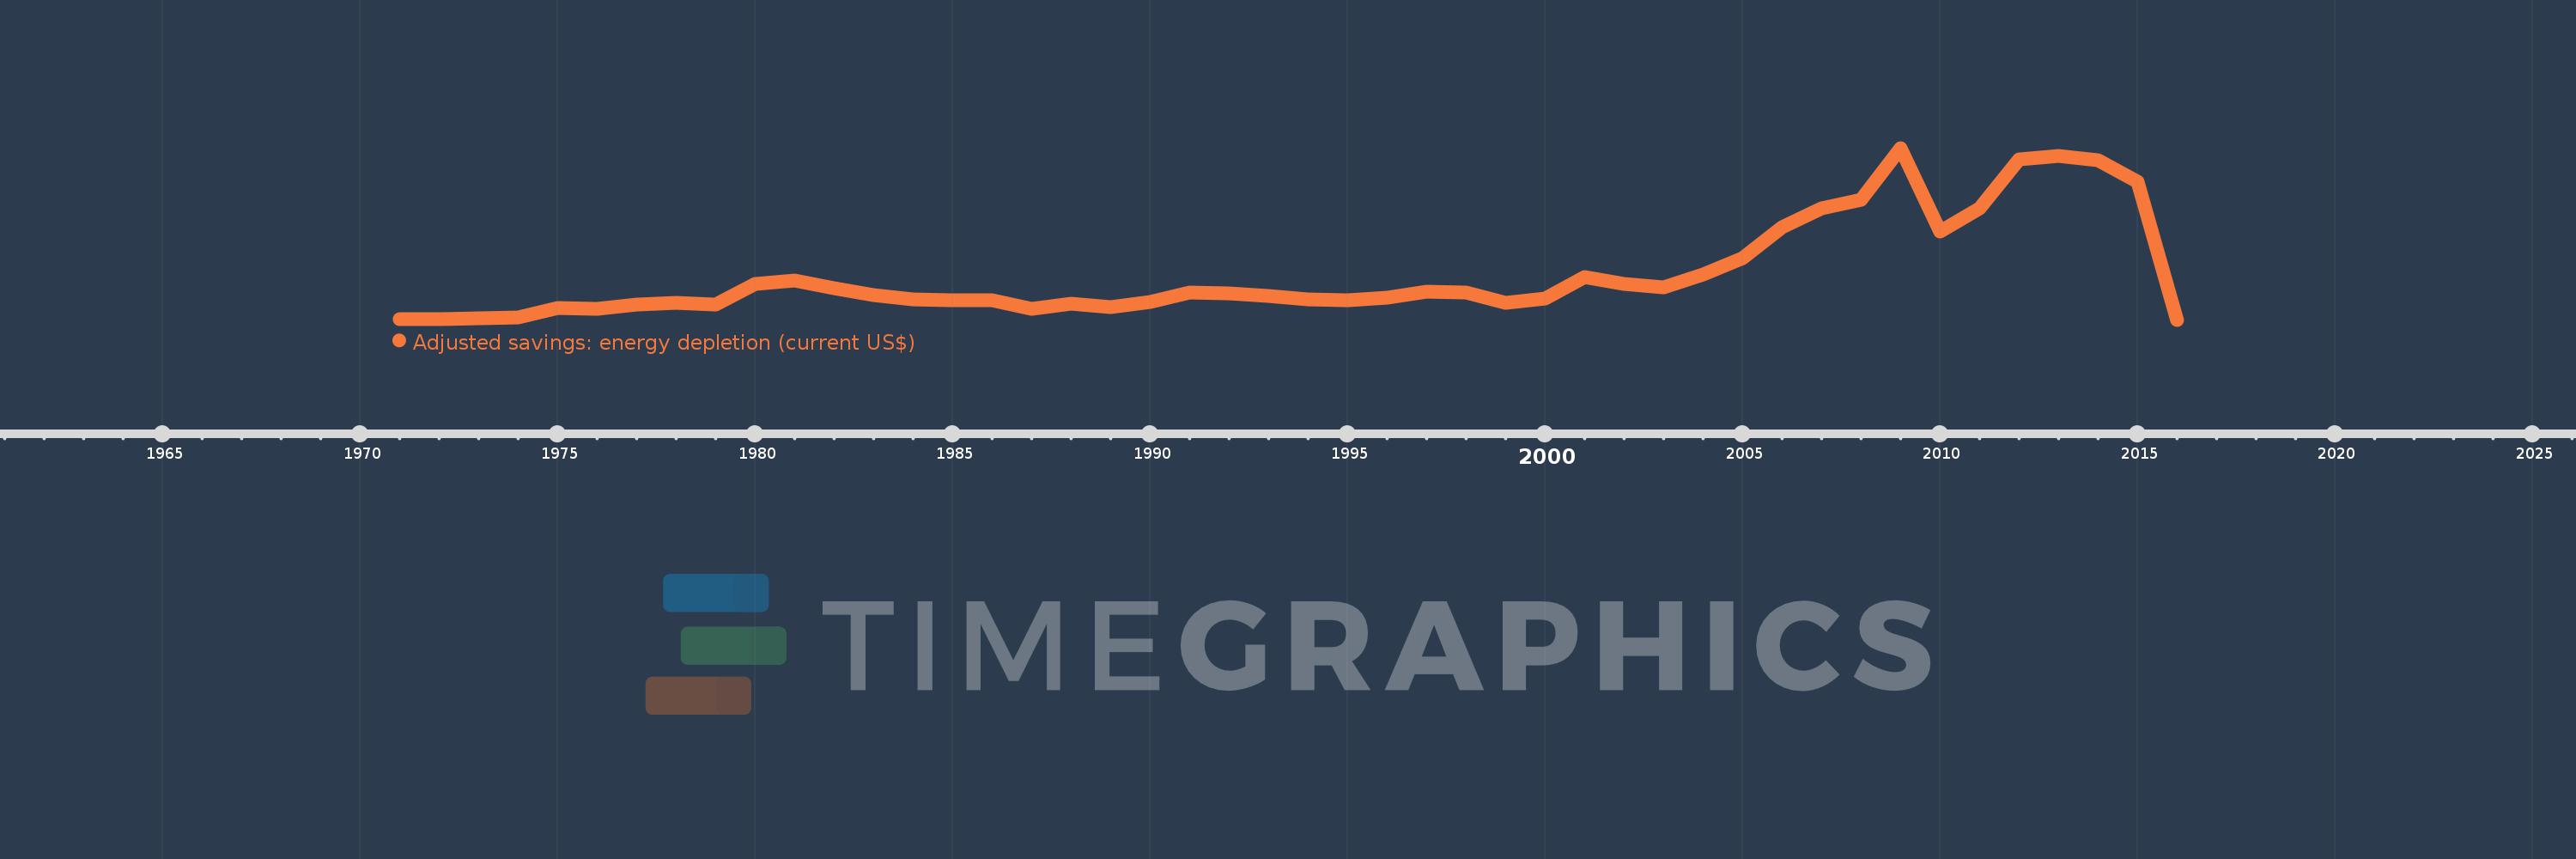
Adjusted savings: energy depletion (current US$)
2016,2015,2014,2013,2012,2011,2010,2009,2008,2007,2006,2005,2004,2003,2002,2001,2000,1999,1998,1997,1996,1995,1994,1993,1992,1991,1990,1989,1988,1987,1986,1985,1984,1983,1982,1981,1980,1979,1978,1977,1976,1975,1974,1973,1972,1971
This statistics in other country:
AfghanistanAlbaniaAlgeriaAmerican SamoaAndorraAngolaAntigua and BarbudaArgentinaArmeniaArubaAustraliaAustriaAzerbaijanBahamas, TheBahrainBangladeshBarbadosBelarusBelgiumBelizeBeninBermudaBhutanBoliviaBosnia and HerzegovinaBotswanaBrazilBrunei DarussalamBulgariaBurkina FasoBurundiCabo VerdeCambodiaCameroonCanadaCayman IslandsCentral African RepublicChadChannel IslandsChileChinaColombiaComorosCongo, Dem. Rep.Congo, Rep.Costa RicaCote d'IvoireCroatiaCubaCuracaoCyprusCzech RepublicDenmarkDjiboutiDominicaDominican RepublicEcuadorEgypt, Arab Rep.El SalvadorEquatorial GuineaEritreaEstoniaEthiopiaFaroe IslandsFijiFinlandFranceFrench PolynesiaGabonGambia, TheGeorgiaGermanyGhanaGibraltarGreeceGreenlandGrenadaGuamGuatemalaGuineaGuinea-BissauGuyanaHaitiHondurasHong Kong SAR, ChinaHungaryIcelandIndiaIndonesiaIran, Islamic Rep.IraqIrelandIsle of ManIsraelItalyJamaicaJapanJordanKazakhstanKenyaKiribatiKorea, Dem. People’s Rep.Korea, Rep.KosovoKuwaitKyrgyz RepublicLao PDRLatviaLebanonLesothoLiberiaLibyaLiechtensteinLithuaniaLuxembourgMacao SAR, ChinaMacedonia, FYRMadagascarMalawiMalaysiaMaldivesMaliMaltaMarshall IslandsMauritaniaMauritiusMexicoMicronesia, Fed. Sts.MoldovaMonacoMongoliaMontenegroMoroccoMozambiqueMyanmarNamibiaNepalNetherlandsNew CaledoniaNew ZealandNicaraguaNigerNigeriaNorthern Mariana IslandsNorwayOmanPakistanPalauPanamaPapua New GuineaParaguayPeruPhilippinesPolandPortugalPuerto RicoQatarRomaniaRussian FederationRwandaSamoaSan MarinoSao Tome and PrincipeSaudi ArabiaSenegalSerbiaSeychellesSierra LeoneSingaporeSint Maarten (Dutch part)Slovak RepublicSloveniaSolomon IslandsSomaliaSouth AfricaSouth SudanSpainSri LankaSt. Kitts and NevisSt. LuciaSt. Martin (French part)St. Vincent and the GrenadinesSudanSurinameSwazilandSwedenSwitzerlandSyrian Arab RepublicTajikistanTanzaniaThailandTimor-LesteTogoTongaTrinidad and TobagoTunisiaTurkeyTurkmenistanTurks and Caicos IslandsTuvaluUgandaUkraineUnited Arab EmiratesUnited KingdomUnited StatesUruguayUzbekistanVanuatuVenezuela, RBVietnamVirgin Islands (U.S.)West Bank and GazaYemen, Rep.ZambiaZimbabwe Timeline:
This timeline shows a graph from 1971 to 2016 of United Arab Emirates. No data until 1970. Number of actual observations by date: 46.
Source name:
World Development Indicators
Source organization:
World Bank staff estimates based on sources and methods in World Bank's "The Changing Wealth of Nations: Measuring Sustainable Development in the New Millennium" (2011).
Categories, topics:
Economy & Growth, Energy & Mining, Environment
Last updated:
apr 23, 2017
Indicators value changes by year
Maximum:
45.666 bln
jan 1, 2009
At the date of observation
Value
Absolute change
Change from previous value
jan 1, 1971
135.161 mln
+135.161 mln
0.0%
jan 1, 1972
264.954 mln
+129.793 mln
96.03%
jan 1, 1973
319.212 mln
+54.258 mln
20.48%
jan 1, 1974
694.871 mln
+375.659 mln
117.68%
jan 1, 1975
3.207 bln
+2.512 bln
361.54%
jan 1, 1976
3.008 bln
-199.567 mln
-6.22%
jan 1, 1977
4.095 bln
+1.087 bln
36.15%
jan 1, 1978
4.581 bln
+486.302 mln
11.88%
jan 1, 1979
4.064 bln
-516.758 mln
-11.28%
jan 1, 1980
9.551 bln
+5.487 bln
135.01%
jan 1, 1981
10.414 bln
+863.009 mln
9.04%
jan 1, 1982
8.377 bln
-2.038 bln
-19.57%
jan 1, 1983
6.481 bln
-1.896 bln
-22.63%
jan 1, 1984
5.305 bln
-1.176 bln
-18.14%
jan 1, 1985
5.2 bln
-104.842 mln
-1.98%
jan 1, 1986
5.071 bln
-129.415 mln
-2.49%
jan 1, 1987
2.879 bln
-2.192 bln
-43.23%
jan 1, 1988
4.172 bln
+1.293 bln
44.92%
jan 1, 1989
3.318 bln
-854.589 mln
-20.48%
jan 1, 1990
4.82 bln
+1.503 bln
45.3%
jan 1, 1991
7.334 bln
+2.514 bln
52.16%
jan 1, 1992
6.912 bln
-422.11 mln
-5.76%
jan 1, 1993
6.311 bln
-601.584 mln
-8.7%
jan 1, 1994
5.447 bln
-863.218 mln
-13.68%
jan 1, 1995
5.243 bln
-204.407 mln
-3.75%
jan 1, 1996
5.908 bln
+665.093 mln
12.69%
jan 1, 1997
7.572 bln
+1.663 bln
28.15%
jan 1, 1998
7.181 bln
-390.293 mln
-5.15%
jan 1, 1999
4.577 bln
-2.604 bln
-36.26%
jan 1, 2000
5.746 bln
+1.168 bln
25.53%
jan 1, 2001
11.39 bln
+5.644 bln
98.23%
jan 1, 2002
9.462 bln
-1.928 bln
-16.93%
jan 1, 2003
8.547 bln
-915.113 mln
-9.67%
jan 1, 2004
11.997 bln
+3.45 bln
40.37%
jan 1, 2005
16.325 bln
+4.328 bln
36.08%
jan 1, 2006
24.657 bln
+8.332 bln
51.04%
jan 1, 2007
29.684 bln
+5.027 bln
20.39%
jan 1, 2008
32.0 bln
+2.315 bln
7.8%
jan 1, 2009
45.666 bln
+13.666 bln
42.71%
jan 1, 2010
23.372 bln
-22.294 bln
-48.82%
jan 1, 2011
29.61 bln
+6.238 bln
26.69%
jan 1, 2012
42.699 bln
+13.089 bln
44.2%
jan 1, 2013
43.553 bln
+854.084 mln
2.0%
jan 1, 2014
42.5 bln
-1.053 bln
-2.42%
jan 1, 2015
36.675 bln
-5.825 bln
-13.71%
jan 1, 2016
0.0
-36.675 bln
-100.0%
Ranking of countries by current statistics by years


Comments: