29
/
en
AIzaSyAYiBZKx7MnpbEhh9jyipgxe19OcubqV5w
April 1, 2024
27724
East Asia & Pacific
EAS
false
2
1
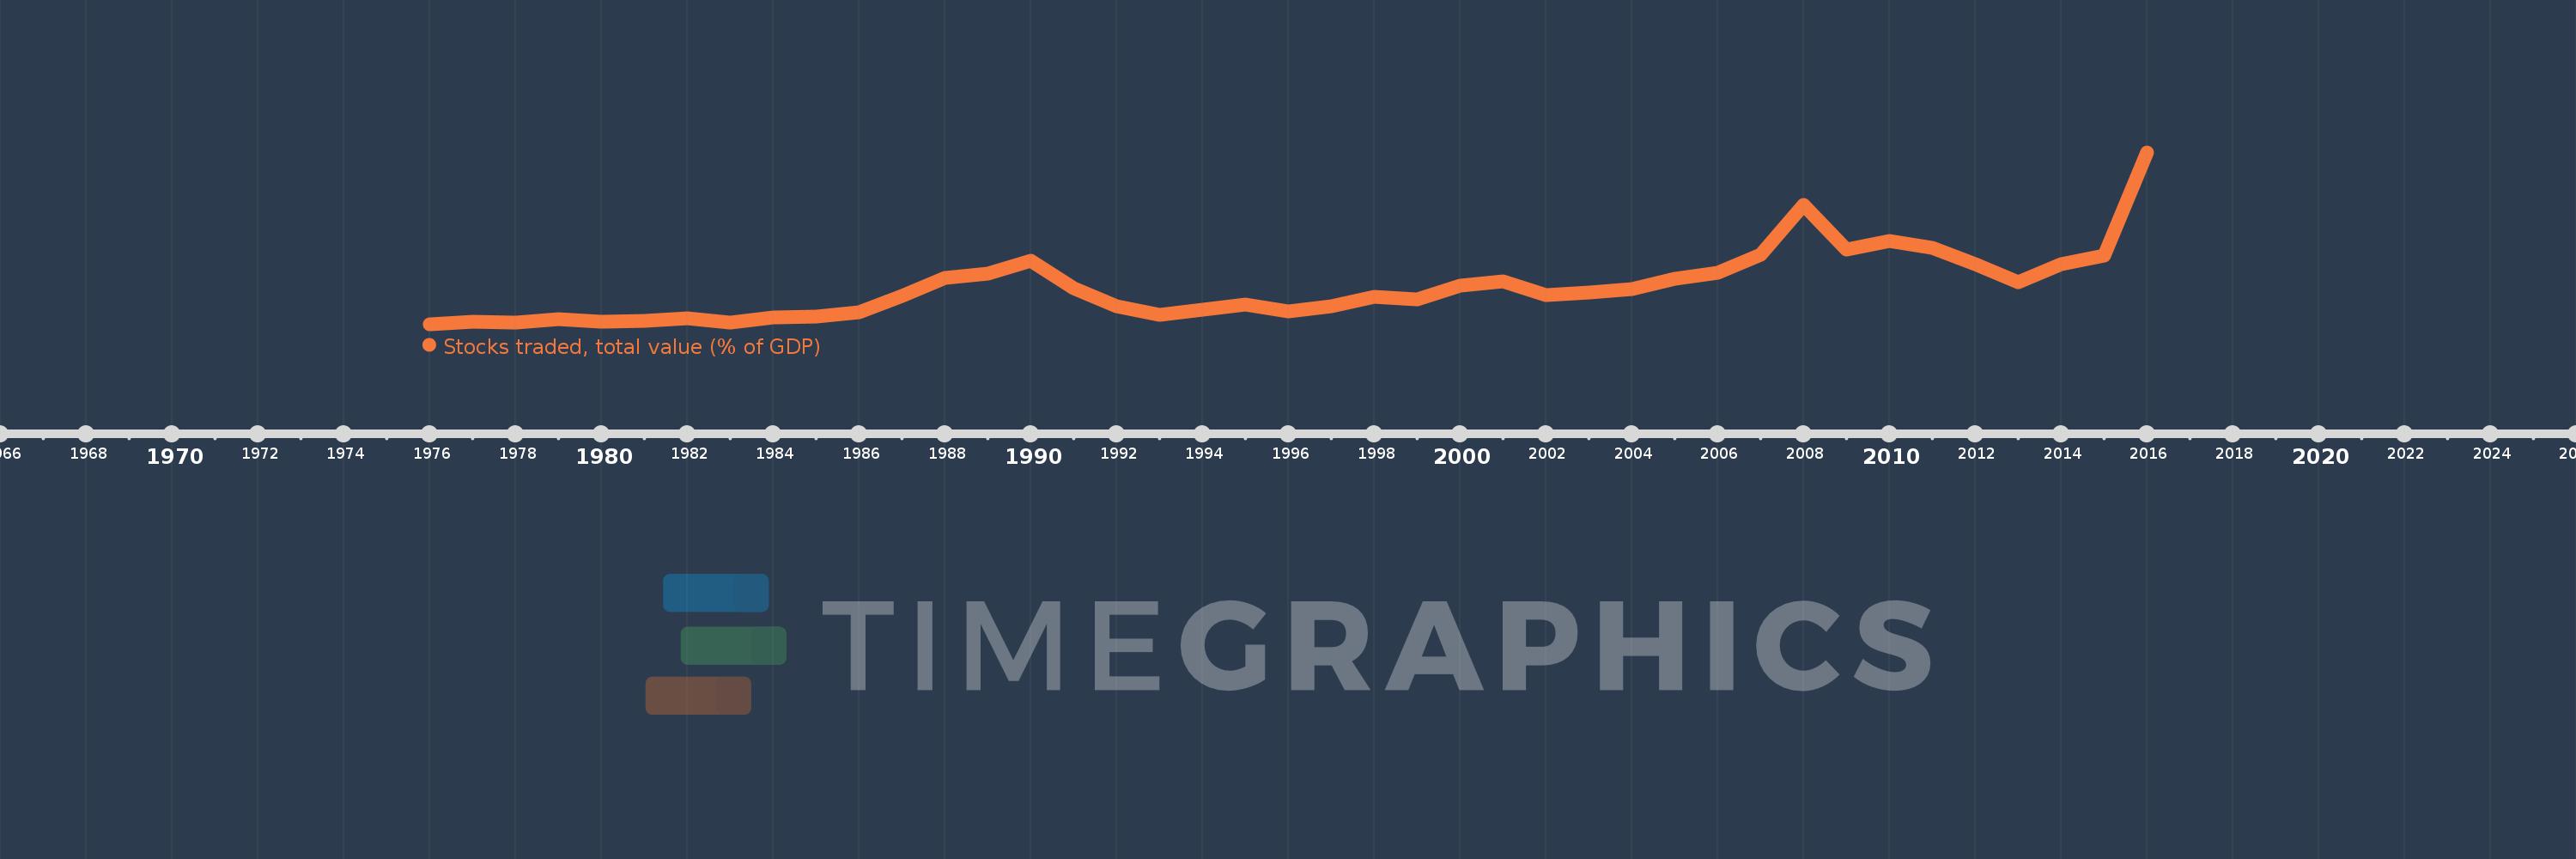
Stocks traded, total value (% of GDP)
2016,2015,2014,2013,2012,2011,2010,2009,2008,2007,2006,2005,2004,2003,2002,2001,2000,1999,1998,1997,1996,1995,1994,1993,1992,1991,1990,1989,1988,1987,1986,1985,1984,1983,1982,1981,1980,1979,1978,1977,1976
This statistics in other country:
Timeline:
This timeline shows a graph from 1976 to 2016 of East Asia & Pacific. No data until 1975. Number of actual observations by date: 41.
Source name:
World Development Indicators
Source organization:
World Federation of Exchanges database.
Categories, topics:
Financial Sector
Last updated:
apr 23, 2017
Indicators value changes by year
Maximum:
240.803
jan 1, 2016
At the date of observation
Value
Absolute change
Change from previous value
jan 1, 1976
9.979
+9.979
0.0%
jan 1, 1977
13.565
+3.587
35.94%
jan 1, 1978
12.528
-1.037
-7.65%
jan 1, 1979
17.235
+4.707
37.57%
jan 1, 1980
13.592
-3.644
-21.14%
jan 1, 1981
13.921
+0.33
2.42%
jan 1, 1982
17.91
+3.989
28.65%
jan 1, 1983
12.436
-5.474
-30.56%
jan 1, 1984
18.834
+6.398
51.45%
jan 1, 1985
20.157
+1.323
7.02%
jan 1, 1986
26.13
+5.972
29.63%
jan 1, 1987
47.426
+21.296
81.5%
jan 1, 1988
72.755
+25.329
53.41%
jan 1, 1989
77.903
+5.148
7.08%
jan 1, 1990
95.325
+17.422
22.36%
jan 1, 1991
58.452
-36.873
-38.68%
jan 1, 1992
34.247
-24.206
-41.41%
jan 1, 1993
23.042
-11.205
-32.72%
jan 1, 1994
29.626
+6.584
28.57%
jan 1, 1995
35.938
+6.312
21.31%
jan 1, 1996
27.041
-8.897
-24.76%
jan 1, 1997
33.586
+6.545
24.2%
jan 1, 1998
46.956
+13.37
39.81%
jan 1, 1999
43.709
-3.247
-6.92%
jan 1, 2000
61.735
+18.026
41.24%
jan 1, 2001
67.616
+5.881
9.53%
jan 1, 2002
49.298
-18.318
-27.09%
jan 1, 2003
52.209
+2.911
5.91%
jan 1, 2004
57.242
+5.033
9.64%
jan 1, 2005
70.556
+13.315
23.26%
jan 1, 2006
79.33
+8.774
12.44%
jan 1, 2007
102.986
+23.656
29.82%
jan 1, 2008
170.632
+67.646
65.68%
jan 1, 2009
109.837
-60.796
-35.63%
jan 1, 2010
121.908
+12.071
10.99%
jan 1, 2011
112.833
-9.075
-7.44%
jan 1, 2012
90.45
-22.383
-19.84%
jan 1, 2013
65.935
-24.515
-27.1%
jan 1, 2014
90.596
+24.661
37.4%
jan 1, 2015
102.393
+11.798
13.02%
jan 1, 2016
240.803
+138.41
135.17%
Ranking of countries by current statistics by years


Comments: