29
/
en
AIzaSyAYiBZKx7MnpbEhh9jyipgxe19OcubqV5w
April 1, 2024
26149
Central Europe and the Baltics
CEB
false
2
1
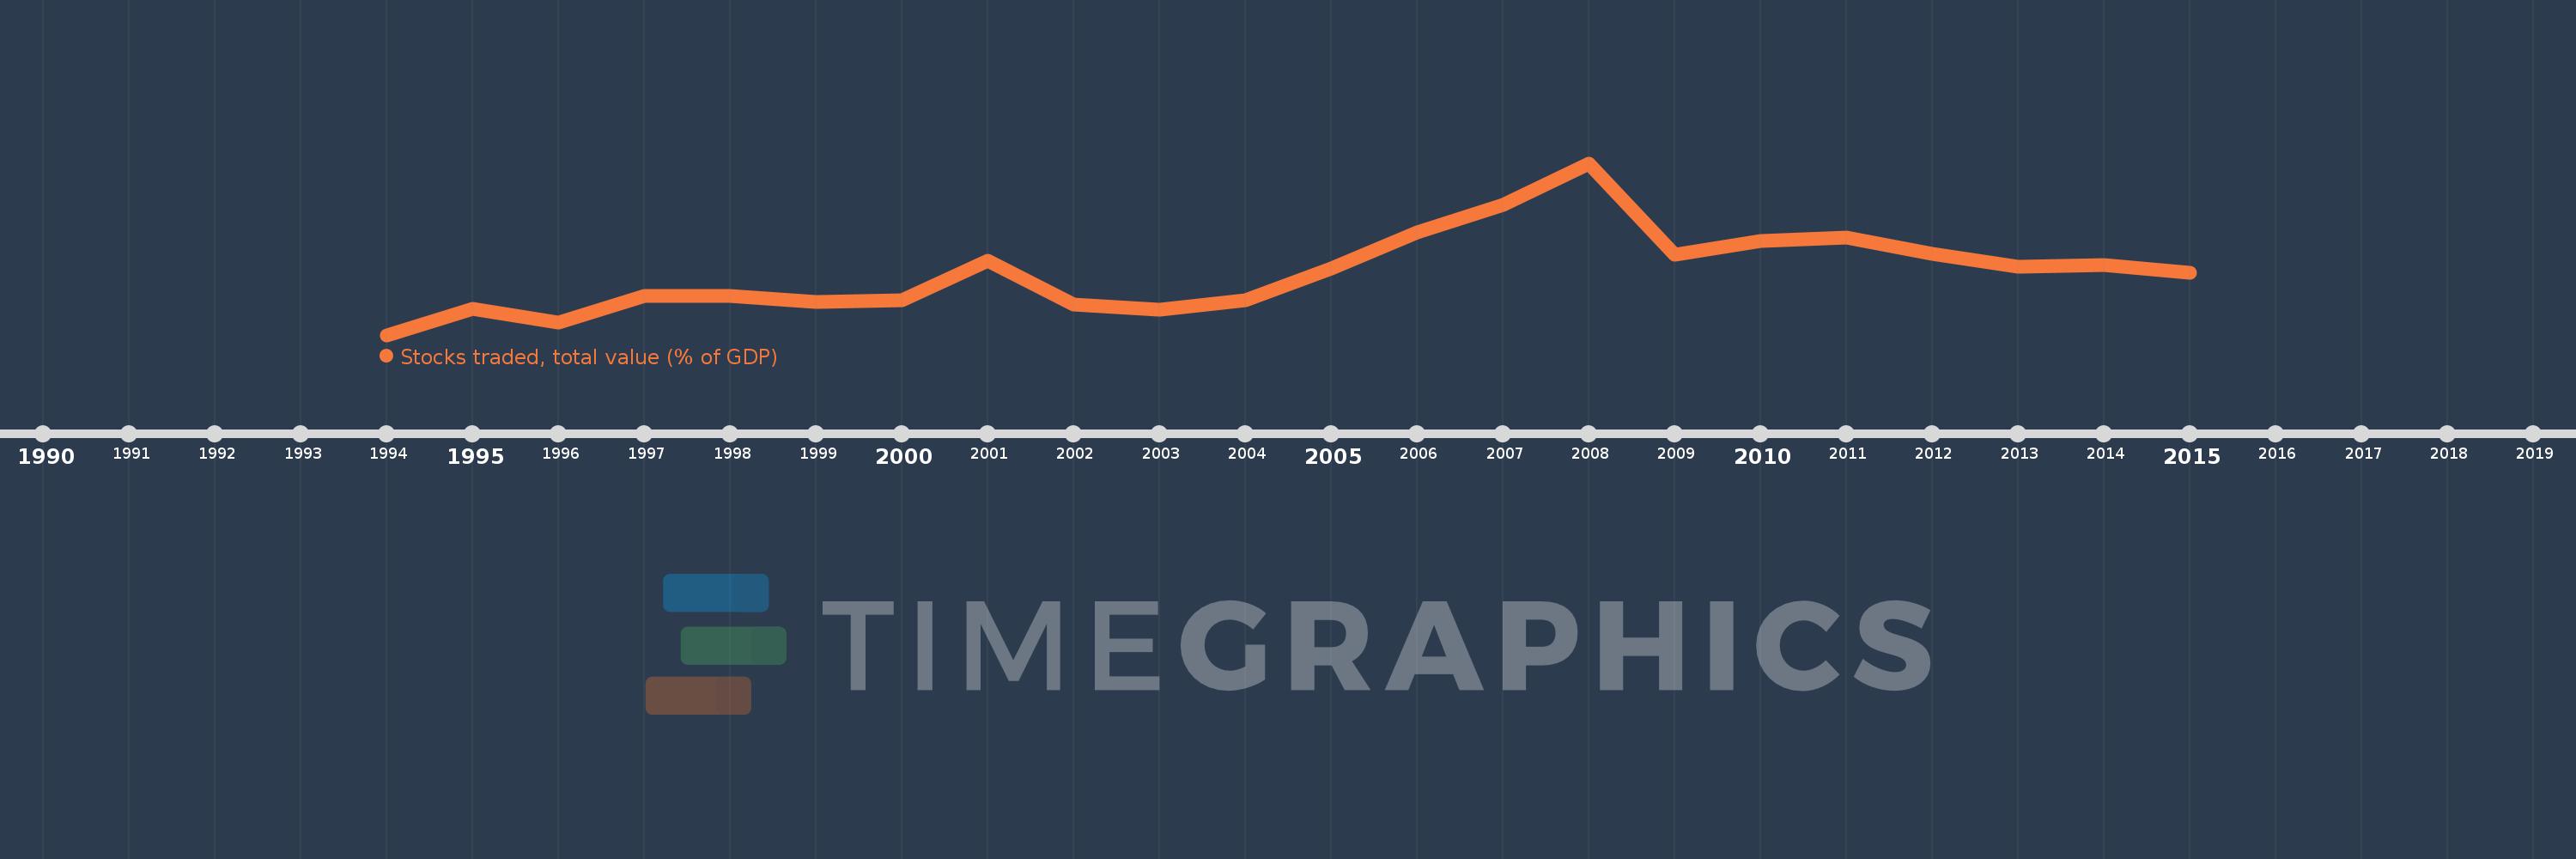
Stocks traded, total value (% of GDP)
2015,2014,2013,2012,2011,2010,2009,2008,2007,2006,2005,2004,2003,2002,2001,2000,1999,1998,1997,1996,1995,1994
This statistics in other country:
Timeline:
This timeline shows a graph from 1994 to 2015 of Central Europe and the Baltics. No data until 1993. Number of actual observations by date: 22.
Source name:
World Development Indicators
Source organization:
World Federation of Exchanges database.
Categories, topics:
Financial Sector
Last updated:
apr 23, 2017
Indicators value changes by year
Maximum:
16.452
jan 1, 2008
At the date of observation
Value
Absolute change
Change from previous value
jan 1, 1994
1.354
+1.354
0.0%
jan 1, 1995
3.677
+2.323
171.58%
jan 1, 1996
2.418
-1.26
-34.25%
jan 1, 1997
4.806
+2.388
98.78%
jan 1, 1998
4.8
-0.006
-0.12%
jan 1, 1999
4.282
-0.518
-10.79%
jan 1, 2000
4.415
+0.133
3.1%
jan 1, 2001
7.9
+3.486
78.96%
jan 1, 2002
4.042
-3.859
-48.84%
jan 1, 2003
3.607
-0.435
-10.76%
jan 1, 2004
4.446
+0.839
23.27%
jan 1, 2005
7.202
+2.755
61.97%
jan 1, 2006
10.408
+3.206
44.52%
jan 1, 2007
12.804
+2.396
23.03%
jan 1, 2008
16.452
+3.647
28.49%
jan 1, 2009
8.383
-8.069
-49.05%
jan 1, 2010
9.634
+1.251
14.92%
jan 1, 2011
9.89
+0.256
2.66%
jan 1, 2012
8.471
-1.419
-14.35%
jan 1, 2013
7.337
-1.134
-13.39%
jan 1, 2014
7.483
+0.146
2.0%
jan 1, 2015
6.838
-0.645
-8.62%
Ranking of countries by current statistics by years


Comments: