29
/
en
AIzaSyAYiBZKx7MnpbEhh9jyipgxe19OcubqV5w
April 1, 2024
163300
Jamaica
JAM
true
2
1
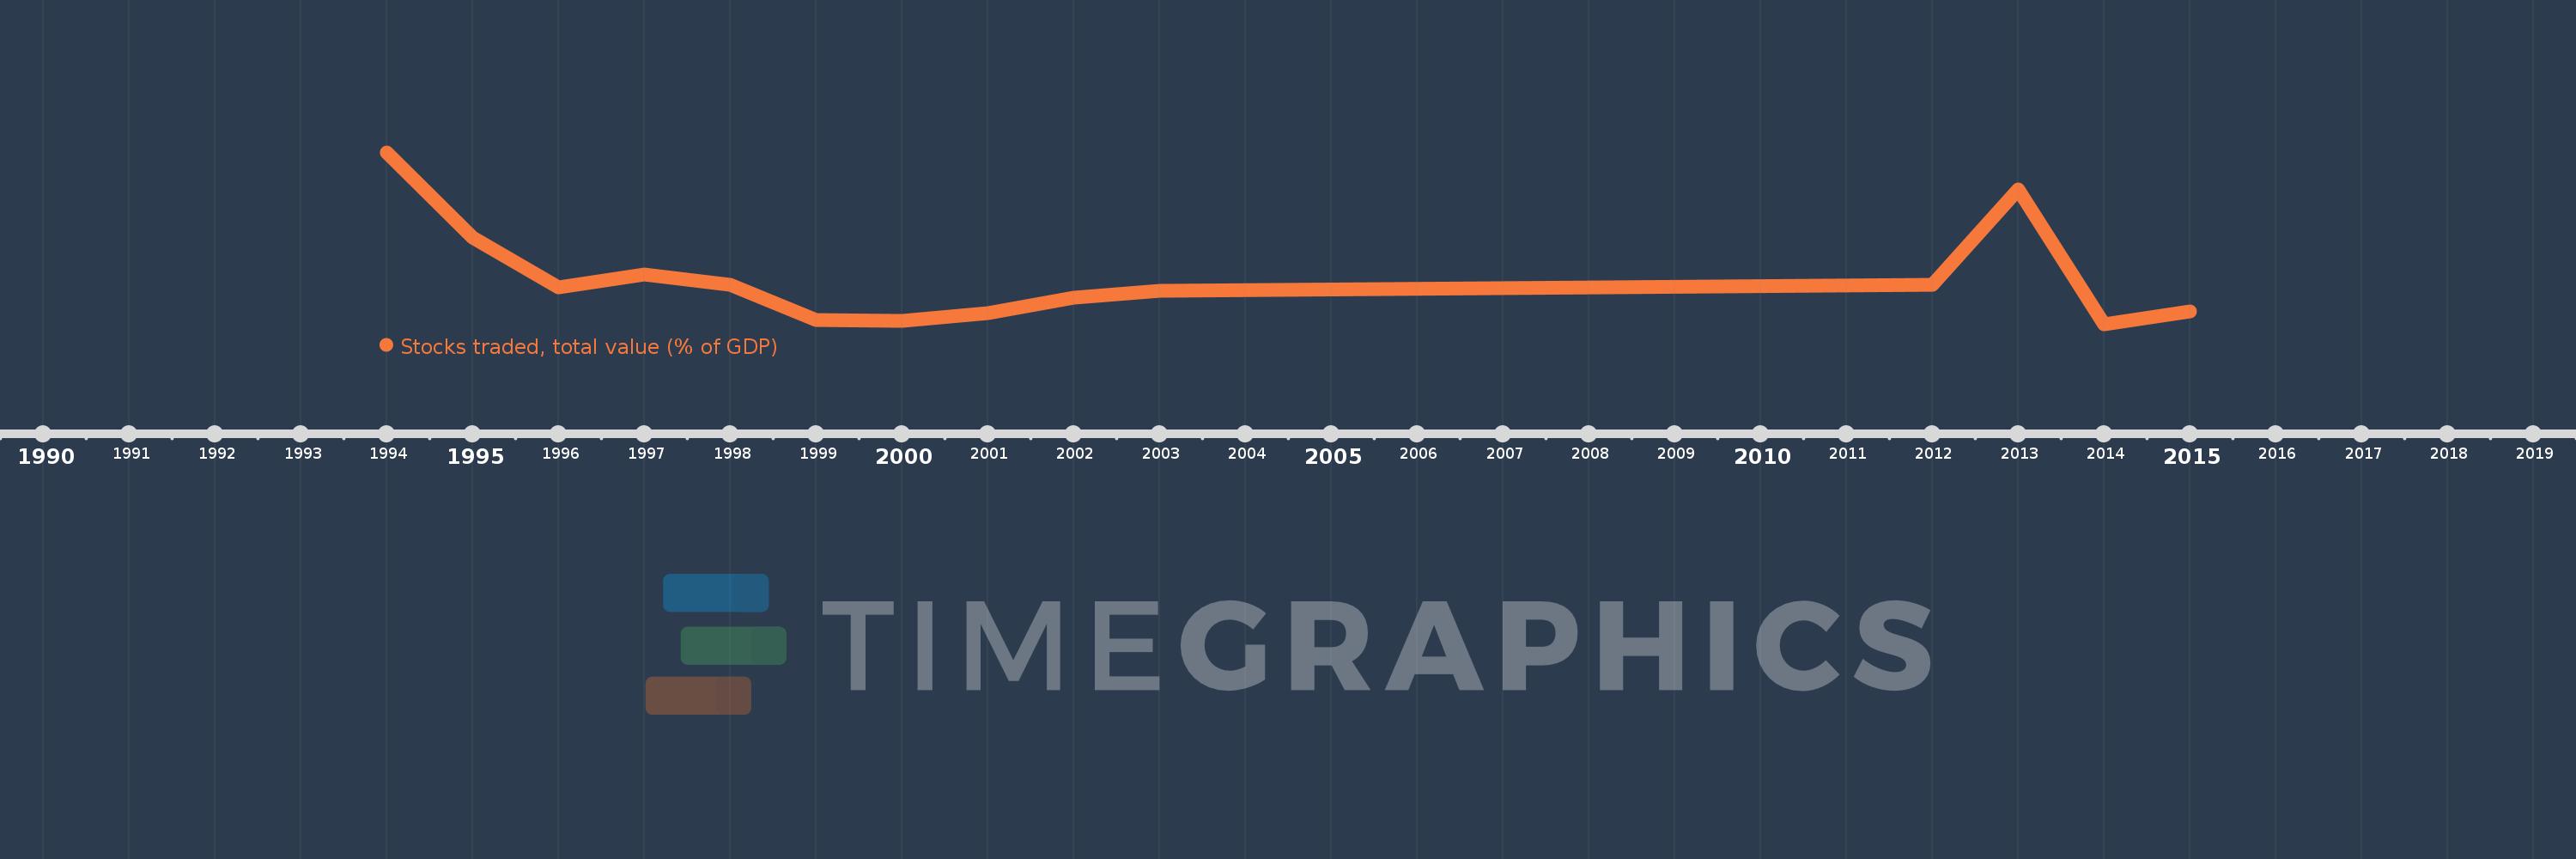
Stocks traded, total value (% of GDP)
2015,2014,2013,2012,2003,2002,2001,2000,1999,1998,1997,1996,1995,1994
This statistics in other country:
Timeline:
This timeline shows a graph from 1994 to 2015 of Jamaica. No data until 1993. Number of actual observations by date: 14.
Source name:
World Development Indicators
Source organization:
World Federation of Exchanges database.
Categories, topics:
Financial Sector
Last updated:
apr 23, 2017
Indicators value changes by year
At the date of observation
Value
Absolute change
Change from previous value
jan 1, 1994
6.035
+6.035
0.0%
jan 1, 1995
3.289
-2.747
-45.51%
jan 1, 1996
1.69
-1.598
-48.6%
jan 1, 1997
2.093
+0.403
23.84%
jan 1, 1998
1.775
-0.319
-15.23%
jan 1, 1999
0.639
-1.136
-63.99%
jan 1, 2000
0.612
-0.027
-4.19%
jan 1, 2001
0.854
+0.242
39.57%
jan 1, 2002
1.364
+0.51
59.68%
jan 1, 2003
1.58
+0.216
15.82%
jan 1, 2012
1.773
+0.193
12.2%
jan 1, 2013
4.84
+3.067
172.96%
jan 1, 2014
0.497
-4.342
-89.72%
jan 1, 2015
0.901
+0.404
81.15%
Ranking of countries by current statistics by years


Comments: