29
/
en
AIzaSyAYiBZKx7MnpbEhh9jyipgxe19OcubqV5w
April 1, 2024
170516
Korea, Rep.
KOR
true
2
1
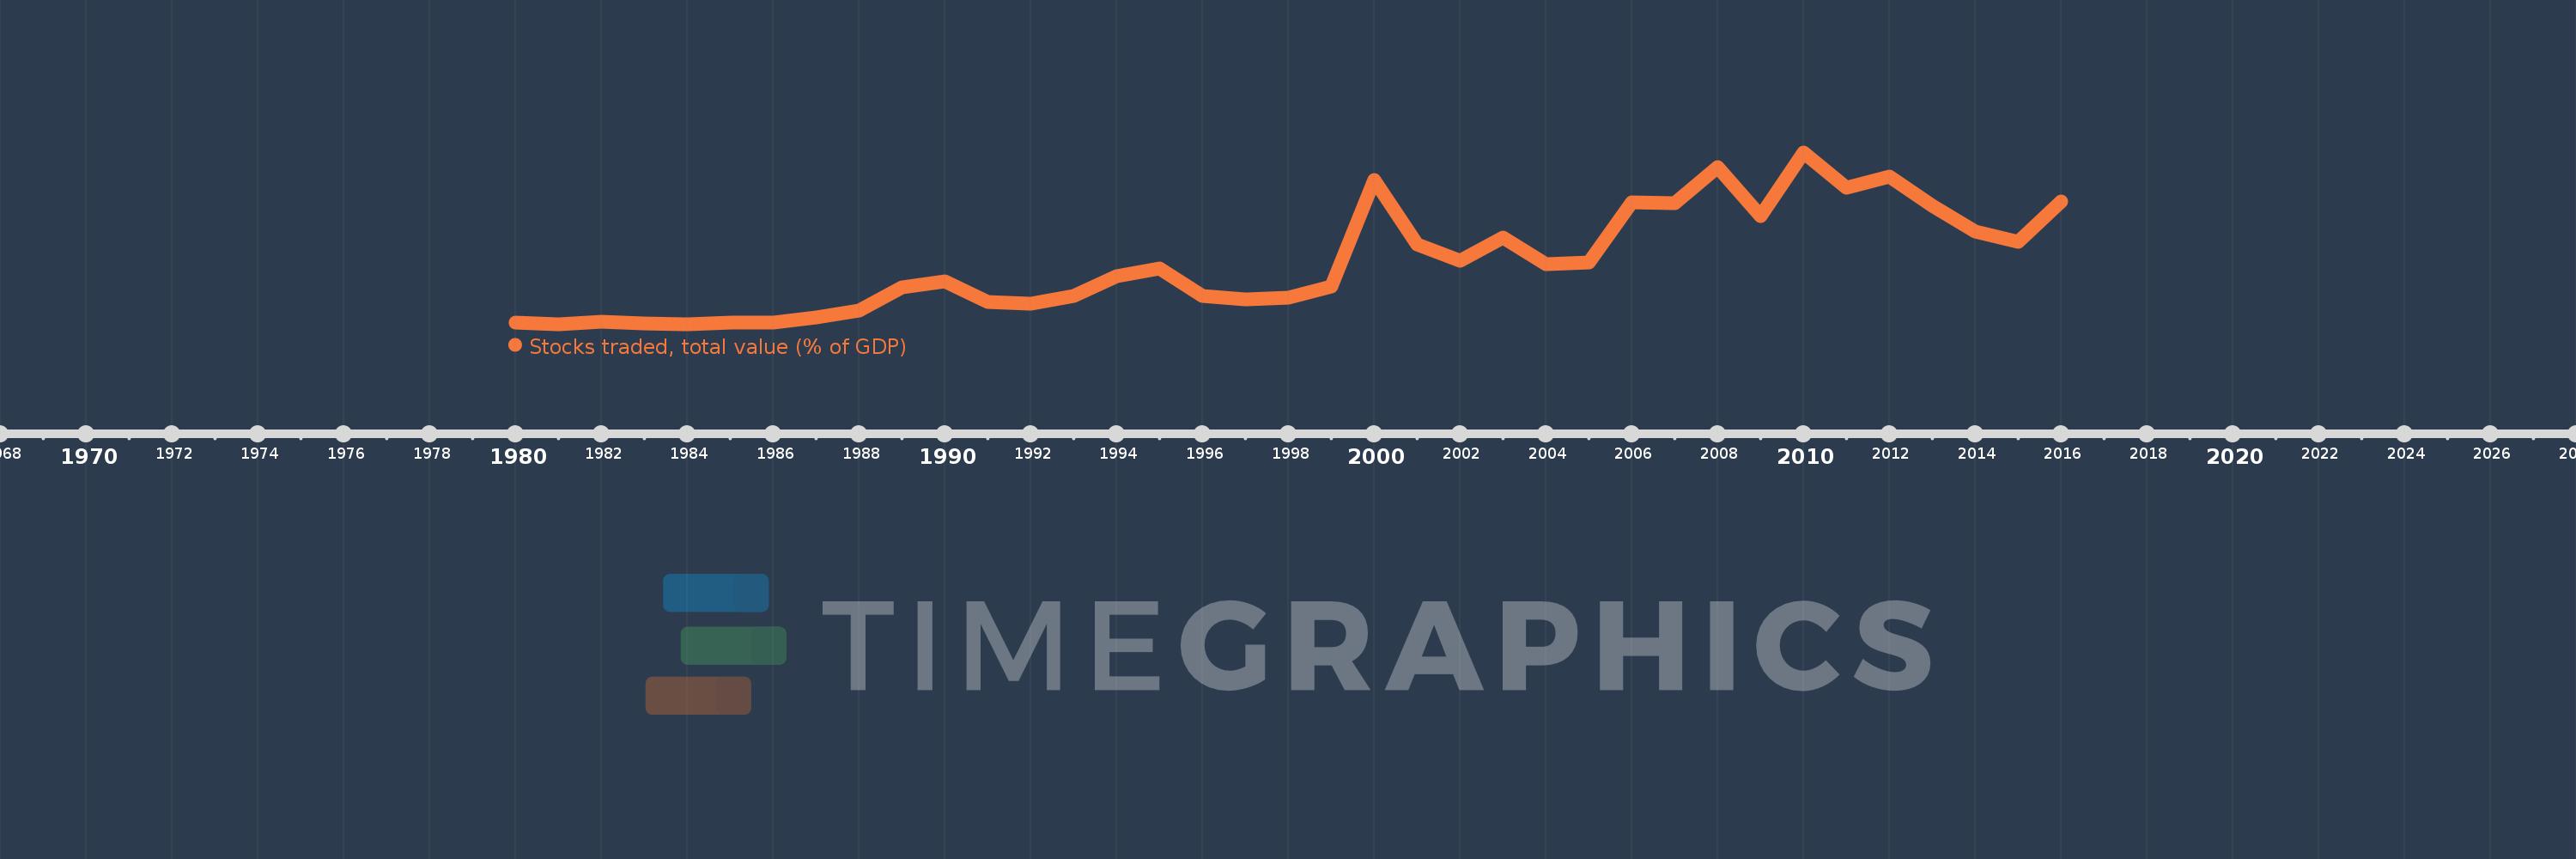
Stocks traded, total value (% of GDP)
2016,2015,2014,2013,2012,2011,2010,2009,2008,2007,2006,2005,2004,2003,2002,2001,2000,1999,1998,1997,1996,1995,1994,1993,1992,1991,1990,1989,1988,1987,1986,1985,1984,1983,1982,1981,1980
This statistics in other country:
Timeline:
This timeline shows a graph from 1980 to 2016 of Korea, Rep.. No data until 1979. Number of actual observations by date: 37.
Source name:
World Development Indicators
Source organization:
World Federation of Exchanges database.
Categories, topics:
Financial Sector
Last updated:
apr 23, 2017
Indicators value changes by year
Maximum:
186.871
jan 1, 2010
At the date of observation
Value
Absolute change
Change from previous value
jan 1, 1980
3.872
+3.872
0.0%
jan 1, 1981
2.753
-1.119
-28.91%
jan 1, 1982
4.745
+1.993
72.39%
jan 1, 1983
3.228
-1.517
-31.97%
jan 1, 1984
2.434
-0.795
-24.61%
jan 1, 1985
3.769
+1.335
54.87%
jan 1, 1986
3.921
+0.152
4.02%
jan 1, 1987
9.303
+5.382
137.26%
jan 1, 1988
17.132
+7.829
84.15%
jan 1, 1989
41.995
+24.863
145.13%
jan 1, 1990
48.029
+6.034
14.37%
jan 1, 1991
26.203
-21.826
-45.44%
jan 1, 1992
24.838
-1.365
-5.21%
jan 1, 1993
32.342
+7.504
30.21%
jan 1, 1994
53.714
+21.372
66.08%
jan 1, 1995
62.53
+8.816
16.41%
jan 1, 1996
32.937
-29.593
-47.33%
jan 1, 1997
29.417
-3.52
-10.69%
jan 1, 1998
30.478
+1.061
3.61%
jan 1, 1999
42.597
+12.119
39.76%
jan 1, 2000
157.24
+114.643
269.13%
jan 1, 2001
88.201
-69.039
-43.91%
jan 1, 2002
70.165
-18.036
-20.45%
jan 1, 2003
95.396
+25.231
35.96%
jan 1, 2004
67.186
-28.21
-29.57%
jan 1, 2005
68.746
+1.56
2.32%
jan 1, 2006
133.578
+64.833
94.31%
jan 1, 2007
132.366
-1.213
-0.91%
jan 1, 2008
170.831
+38.466
29.06%
jan 1, 2009
118.459
-52.372
-30.66%
jan 1, 2010
186.871
+68.412
57.75%
jan 1, 2011
148.904
-37.967
-20.32%
jan 1, 2012
160.87
+11.966
8.04%
jan 1, 2013
129.593
-31.277
-19.44%
jan 1, 2014
101.857
-27.736
-21.4%
jan 1, 2015
90.956
-10.901
-10.7%
jan 1, 2016
133.81
+42.853
47.11%
Ranking of countries by current statistics by years


Comments: