29
/
en
AIzaSyAYiBZKx7MnpbEhh9jyipgxe19OcubqV5w
April 1, 2024
230455
Russian Federation
RUS
true
2
1
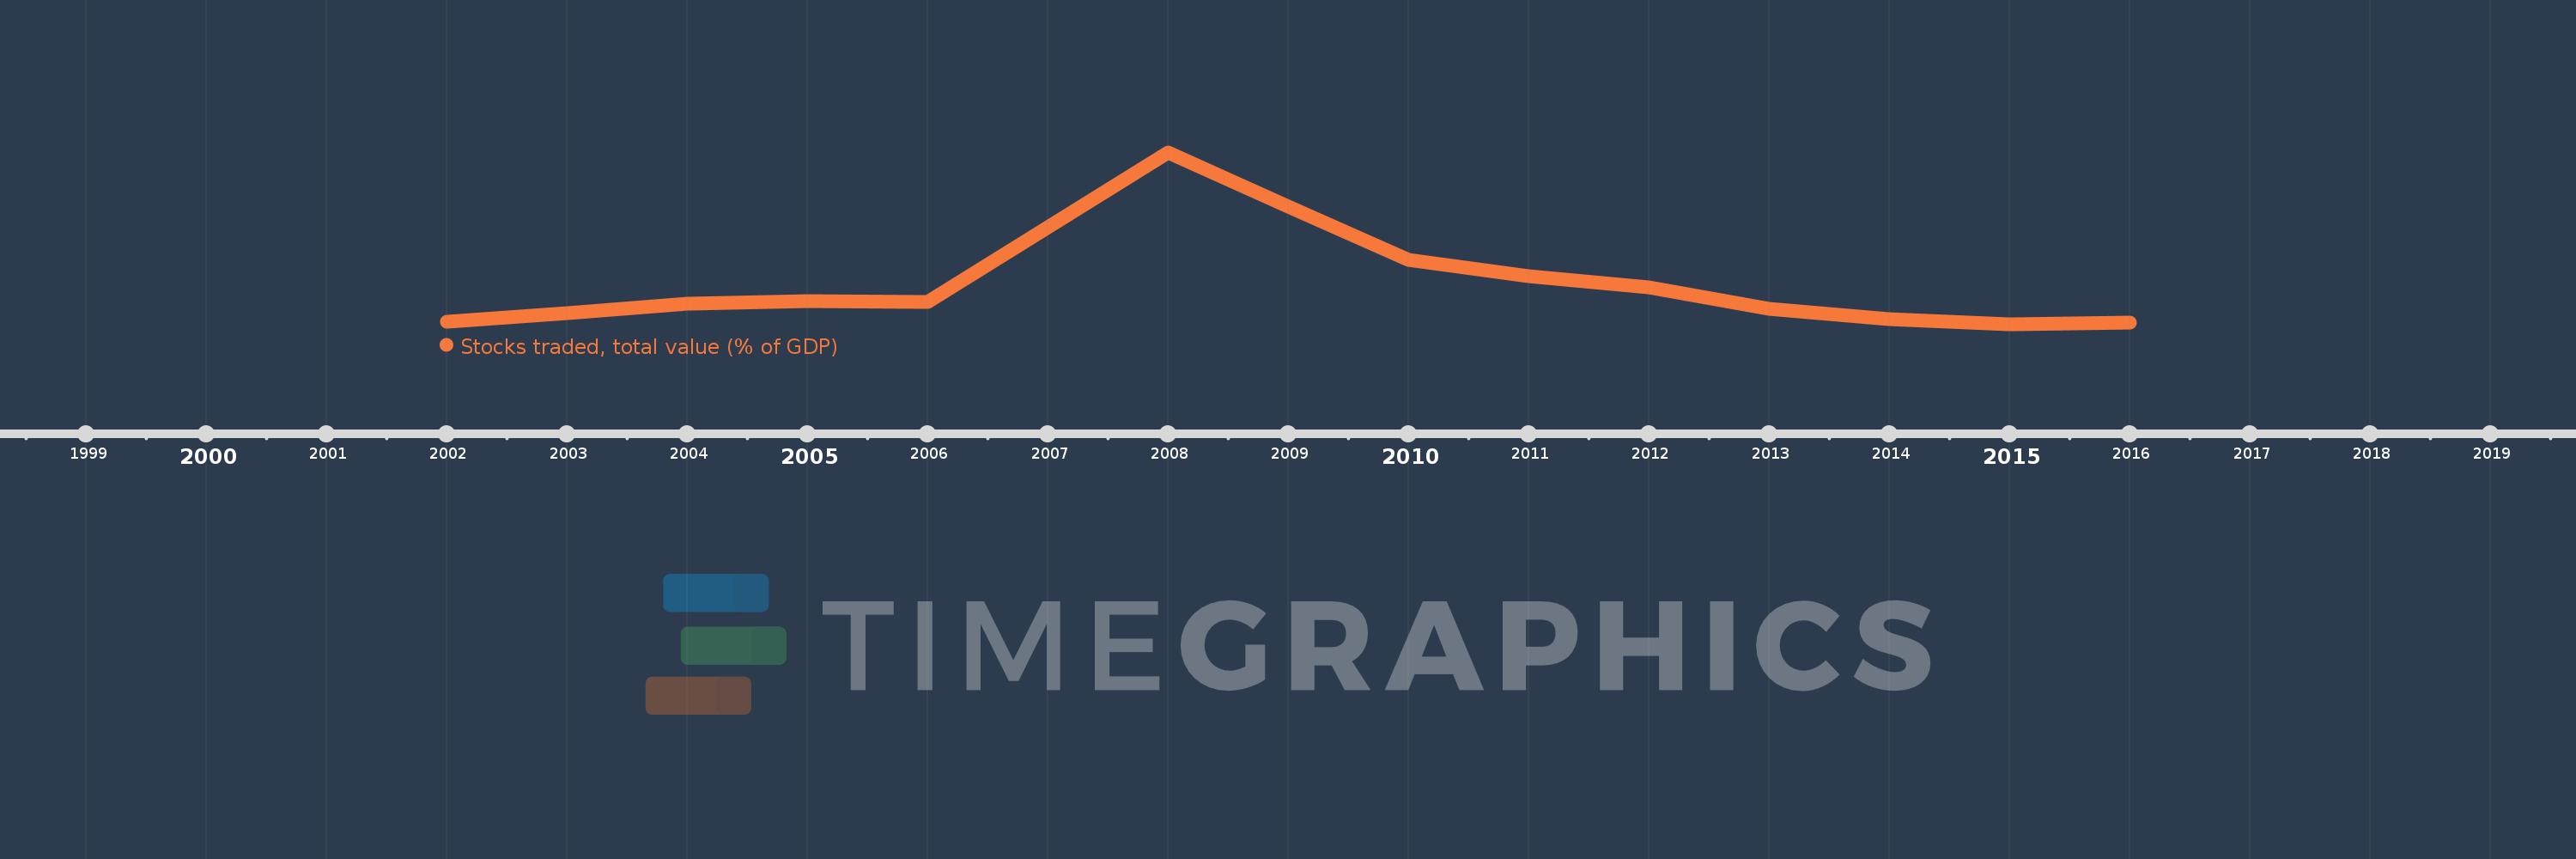
Stocks traded, total value (% of GDP)
2016,2015,2014,2013,2012,2011,2010,2009,2008,2007,2006,2005,2004,2003,2002
This statistics in other country:
Timeline:
This timeline shows a graph from 2002 to 2016 of Russian Federation. No data until 2001. Number of actual observations by date: 15.
Source name:
World Development Indicators
Source organization:
World Federation of Exchanges database.
Categories, topics:
Financial Sector
Last updated:
apr 23, 2017
Indicators value changes by year
Maximum:
98.255
jan 1, 2008
At the date of observation
Value
Absolute change
Change from previous value
jan 1, 2002
9.198
+9.198
0.0%
jan 1, 2003
13.812
+4.614
50.16%
jan 1, 2004
18.525
+4.713
34.12%
jan 1, 2005
20.083
+1.558
8.41%
jan 1, 2006
19.356
-0.727
-3.62%
jan 1, 2007
58.858
+39.501
204.07%
jan 1, 2008
98.255
+39.397
66.94%
jan 1, 2009
69.544
-28.711
-29.22%
jan 1, 2010
41.745
-27.799
-39.97%
jan 1, 2011
33.238
-8.507
-20.38%
jan 1, 2012
27.248
-5.99
-18.02%
jan 1, 2013
15.799
-11.45
-42.02%
jan 1, 2014
10.552
-5.246
-33.21%
jan 1, 2015
7.791
-2.761
-26.17%
jan 1, 2016
8.813
+1.022
13.11%
Ranking of countries by current statistics by years


Comments: