29
/
en
AIzaSyAYiBZKx7MnpbEhh9jyipgxe19OcubqV5w
April 1, 2024
51512
Middle income
MIC
false
2
1
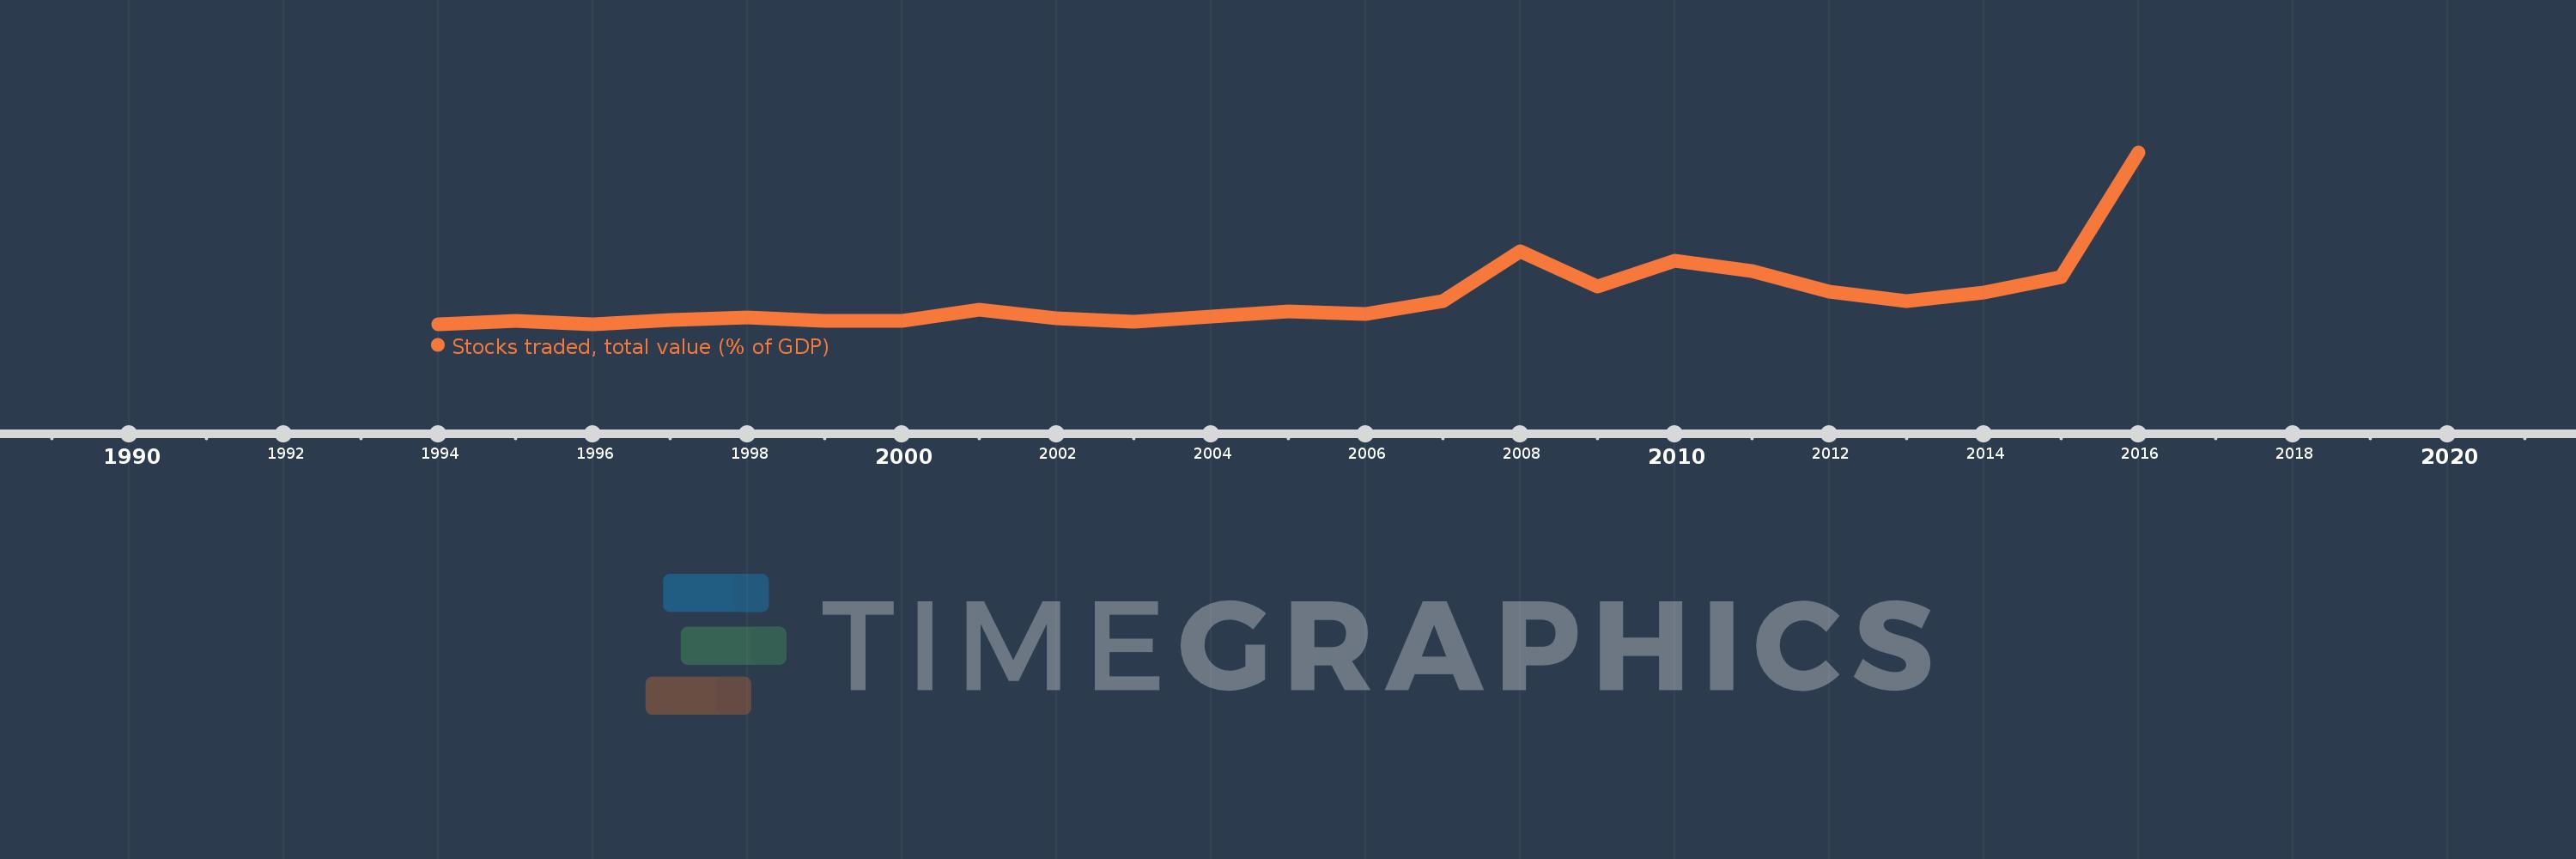
Stocks traded, total value (% of GDP)
2016,2015,2014,2013,2012,2011,2010,2009,2008,2007,2006,2005,2004,2003,2002,2001,2000,1999,1998,1997,1996,1995,1994
This statistics in other country:
Timeline:
This timeline shows a graph from 1994 to 2016 of Middle income. No data until 1993. Number of actual observations by date: 23.
Source name:
World Development Indicators
Source organization:
World Federation of Exchanges database.
Categories, topics:
Financial Sector
Last updated:
apr 23, 2017
Indicators value changes by year
Minimum:
12.118
jan 1, 1994
Maximum:
182.447
jan 1, 2016
At the date of observation
Value
Absolute change
Change from previous value
jan 1, 1994
12.118
+12.118
0.0%
jan 1, 1995
15.305
+3.187
26.3%
jan 1, 1996
12.348
-2.958
-19.32%
jan 1, 1997
16.565
+4.217
34.15%
jan 1, 1998
18.951
+2.386
14.41%
jan 1, 1999
15.464
-3.487
-18.4%
jan 1, 2000
15.256
-0.208
-1.34%
jan 1, 2001
26.185
+10.929
71.63%
jan 1, 2002
17.892
-8.293
-31.67%
jan 1, 2003
14.75
-3.141
-17.56%
jan 1, 2004
19.652
+4.901
33.23%
jan 1, 2005
24.74
+5.088
25.89%
jan 1, 2006
22.354
-2.386
-9.64%
jan 1, 2007
35.216
+12.862
57.54%
jan 1, 2008
84.698
+49.482
140.51%
jan 1, 2009
49.798
-34.9
-41.21%
jan 1, 2010
74.944
+25.146
50.5%
jan 1, 2011
65.162
-9.782
-13.05%
jan 1, 2012
44.729
-20.433
-31.36%
jan 1, 2013
34.715
-10.014
-22.39%
jan 1, 2014
43.267
+8.552
24.64%
jan 1, 2015
58.869
+15.602
36.06%
jan 1, 2016
182.447
+123.578
209.92%
Ranking of countries by current statistics by years


Comments: