29
/
en
AIzaSyAYiBZKx7MnpbEhh9jyipgxe19OcubqV5w
April 1, 2024
108018
Colombia
COL
true
2
1
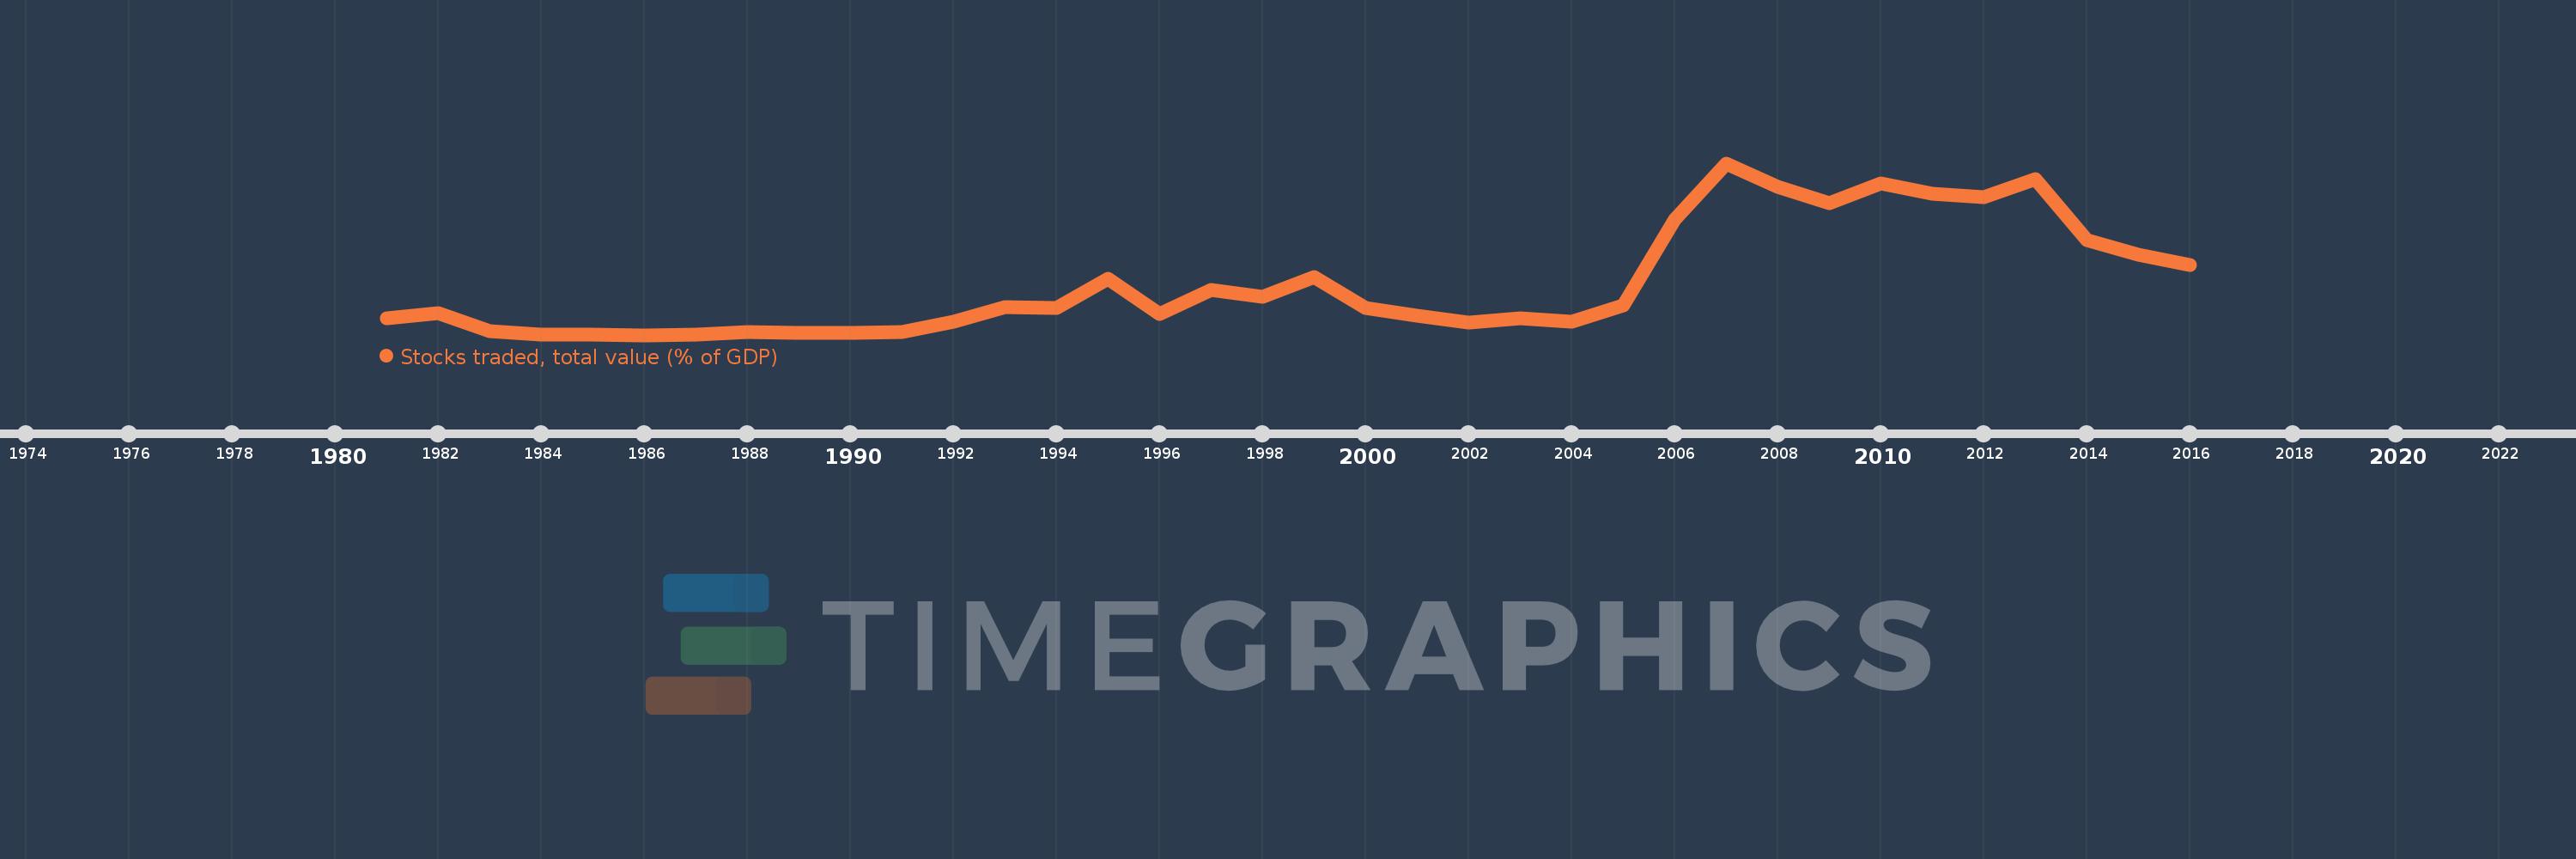
Stocks traded, total value (% of GDP)
2016,2015,2014,2013,2012,2011,2010,2009,2008,2007,2006,2005,2004,2003,2002,2001,2000,1999,1998,1997,1996,1995,1994,1993,1992,1991,1990,1989,1988,1987,1986,1985,1984,1983,1982,1981
This statistics in other country:
Timeline:
This timeline shows a graph from 1981 to 2016 of Colombia. No data until 1980. Number of actual observations by date: 36.
Source name:
World Development Indicators
Source organization:
World Federation of Exchanges database.
Categories, topics:
Financial Sector
Last updated:
apr 23, 2017
Indicators value changes by year
At the date of observation
Value
Absolute change
Change from previous value
jan 1, 1981
1.069
+1.069
0.0%
jan 1, 1982
1.347
+0.278
25.99%
jan 1, 1983
0.318
-1.028
-76.37%
jan 1, 1984
0.16
-0.158
-49.69%
jan 1, 1985
0.141
-0.019
-11.82%
jan 1, 1986
0.123
-0.018
-12.71%
jan 1, 1987
0.149
+0.026
20.76%
jan 1, 1988
0.289
+0.14
93.98%
jan 1, 1989
0.242
-0.046
-16.07%
jan 1, 1990
0.255
+0.013
5.44%
jan 1, 1991
0.268
+0.013
4.98%
jan 1, 1992
0.868
+0.6
223.72%
jan 1, 1993
1.68
+0.812
93.55%
jan 1, 1994
1.627
-0.053
-3.16%
jan 1, 1995
3.223
+1.595
98.05%
jan 1, 1996
1.299
-1.923
-59.68%
jan 1, 1997
2.632
+1.332
102.54%
jan 1, 1998
2.24
-0.392
-14.89%
jan 1, 1999
3.315
+1.075
47.98%
jan 1, 2000
1.604
-1.711
-51.62%
jan 1, 2001
1.18
-0.423
-26.39%
jan 1, 2002
0.798
-0.382
-32.36%
jan 1, 2003
1.053
+0.254
31.87%
jan 1, 2004
0.851
-0.202
-19.16%
jan 1, 2005
1.776
+0.925
108.72%
jan 1, 2006
6.515
+4.739
266.77%
jan 1, 2007
9.605
+3.09
47.43%
jan 1, 2008
8.315
-1.29
-13.43%
jan 1, 2009
7.392
-0.924
-11.11%
jan 1, 2010
8.489
+1.098
14.85%
jan 1, 2011
7.908
-0.581
-6.85%
jan 1, 2012
7.736
-0.172
-2.18%
jan 1, 2013
8.712
+0.976
12.62%
jan 1, 2014
5.368
-3.343
-38.38%
jan 1, 2015
4.549
-0.819
-15.25%
jan 1, 2016
3.967
-0.583
-12.81%
Ranking of countries by current statistics by years


Comments: