29
/
en
AIzaSyAYiBZKx7MnpbEhh9jyipgxe19OcubqV5w
April 1, 2024
153104
Hungary
HUN
true
2
1
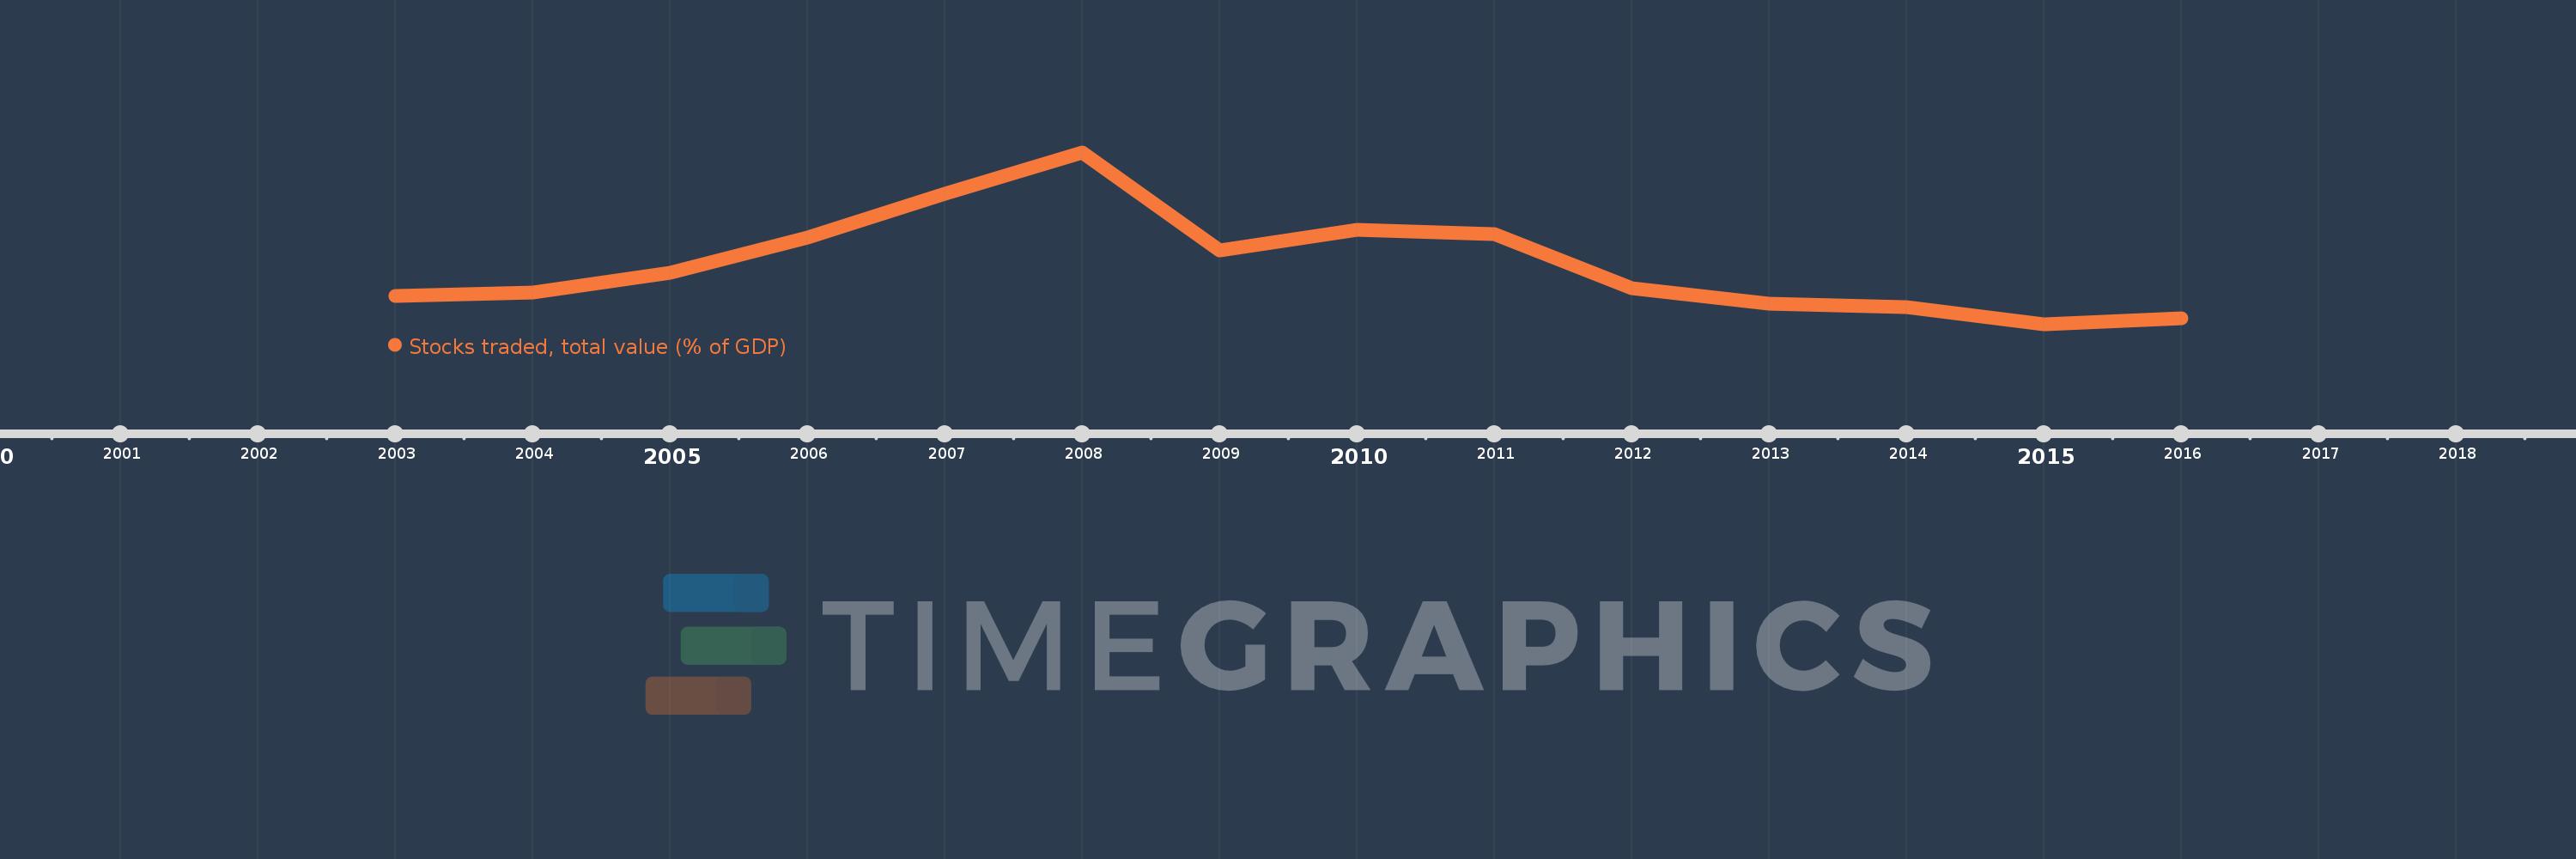
Stocks traded, total value (% of GDP)
2016,2015,2014,2013,2012,2011,2010,2009,2008,2007,2006,2005,2004,2003
This statistics in other country:
Timeline:
This timeline shows a graph from 2003 to 2016 of Hungary. No data until 2002. Number of actual observations by date: 14.
Source name:
World Development Indicators
Source organization:
World Federation of Exchanges database.
Categories, topics:
Financial Sector
Last updated:
apr 23, 2017
Indicators value changes by year
Maximum:
33.971
jan 1, 2008
At the date of observation
Value
Absolute change
Change from previous value
jan 1, 2003
9.831
+9.831
0.0%
jan 1, 2004
10.42
+0.589
5.99%
jan 1, 2005
13.761
+3.341
32.06%
jan 1, 2006
19.686
+5.925
43.05%
jan 1, 2007
26.992
+7.306
37.11%
jan 1, 2008
33.971
+6.979
25.86%
jan 1, 2009
17.524
-16.446
-48.41%
jan 1, 2010
20.933
+3.409
19.45%
jan 1, 2011
20.318
-0.615
-2.94%
jan 1, 2012
11.173
-9.146
-45.01%
jan 1, 2013
8.611
-2.562
-22.93%
jan 1, 2014
8.036
-0.575
-6.68%
jan 1, 2015
5.107
-2.929
-36.45%
jan 1, 2016
6.113
+1.006
19.7%
Ranking of countries by current statistics by years


Comments: