29
/
en
AIzaSyAYiBZKx7MnpbEhh9jyipgxe19OcubqV5w
April 1, 2024
235164
Saudi Arabia
SAU
true
2
1
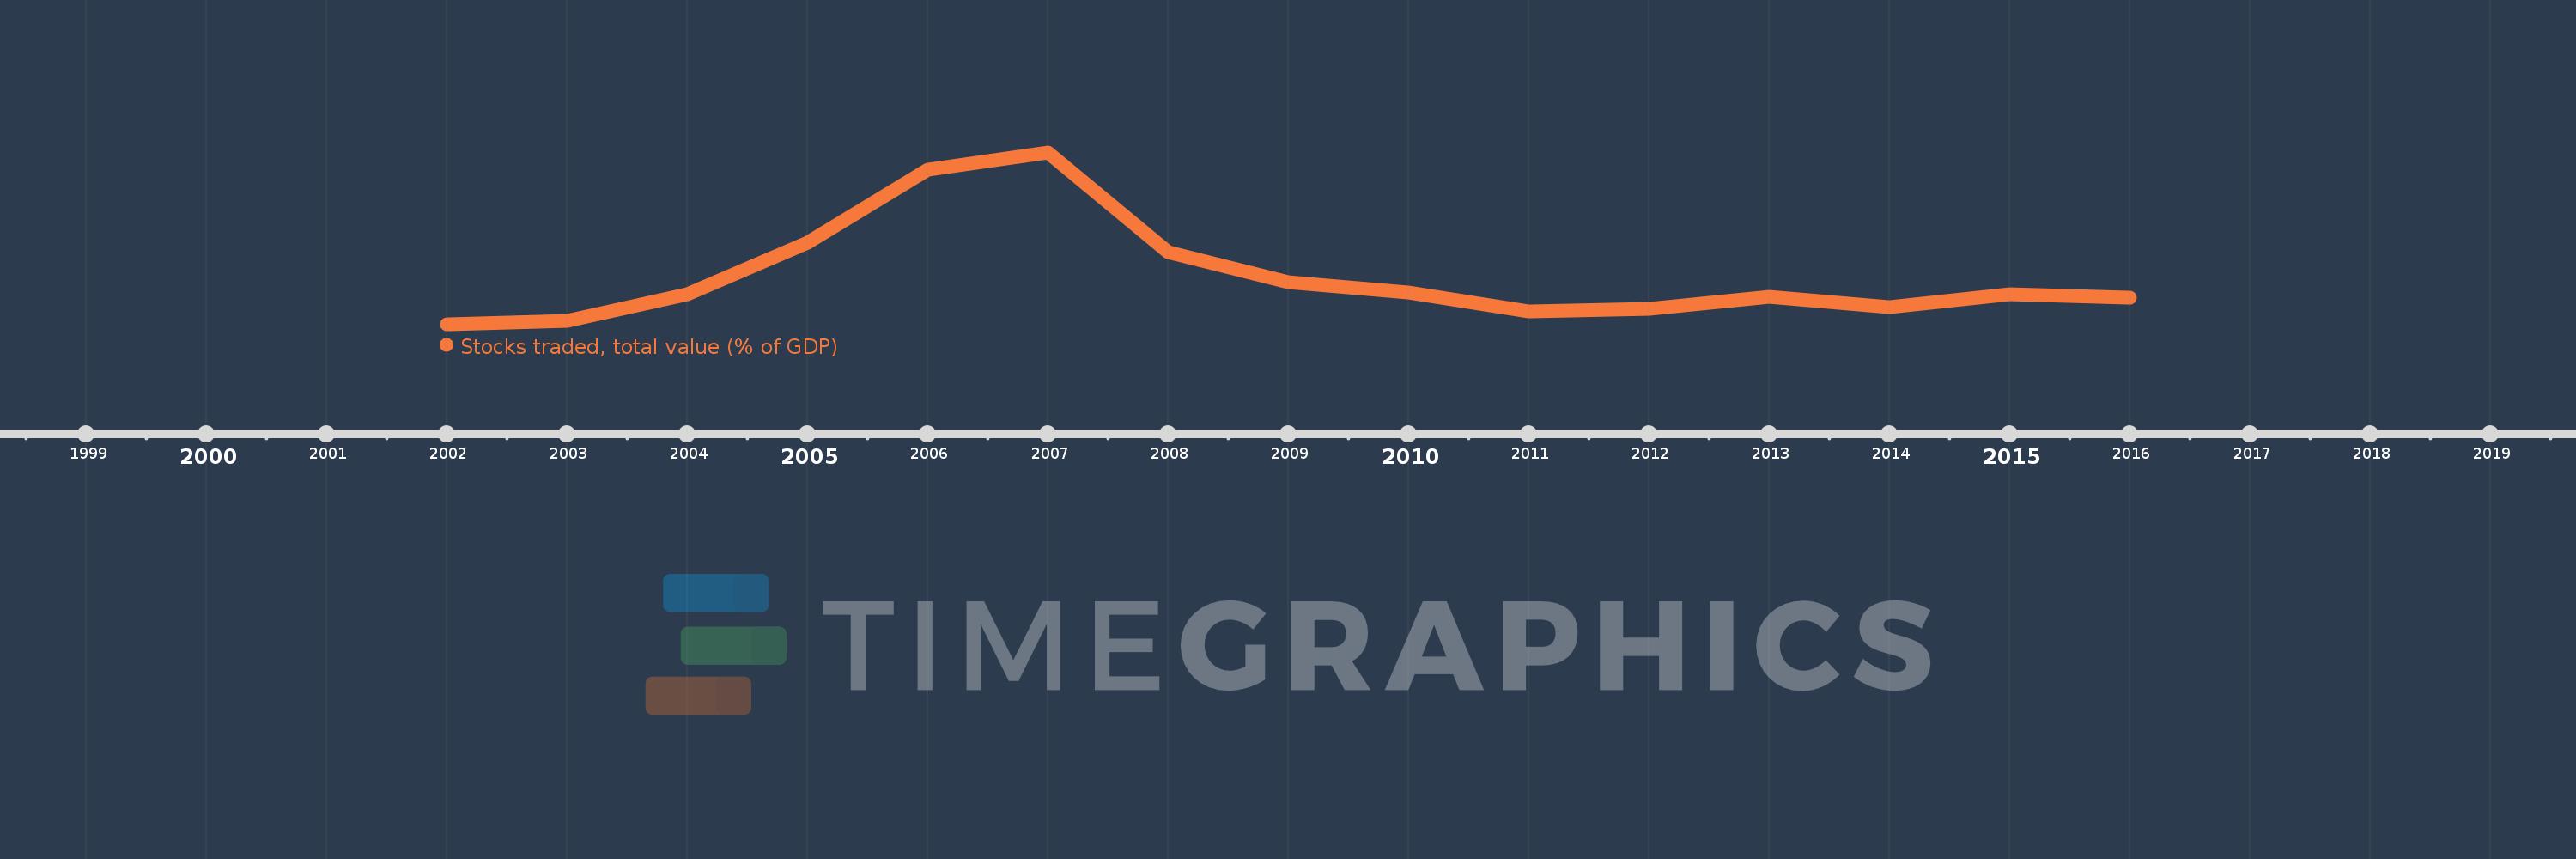
Stocks traded, total value (% of GDP)
2016,2015,2014,2013,2012,2011,2010,2009,2008,2007,2006,2005,2004,2003,2002
This statistics in other country:
Timeline:
This timeline shows a graph from 2002 to 2016 of Saudi Arabia. No data until 2001. Number of actual observations by date: 15.
Source name:
World Development Indicators
Source organization:
World Federation of Exchanges database.
Categories, topics:
Financial Sector
Last updated:
apr 23, 2017
Indicators value changes by year
Maximum:
372.26
jan 1, 2007
At the date of observation
Value
Absolute change
Change from previous value
jan 1, 2002
12.18
+12.18
0.0%
jan 1, 2003
18.922
+6.742
55.35%
jan 1, 2004
74.127
+55.205
291.75%
jan 1, 2005
182.785
+108.658
146.58%
jan 1, 2006
335.973
+153.188
83.81%
jan 1, 2007
372.26
+36.287
10.8%
jan 1, 2008
163.944
-208.316
-55.96%
jan 1, 2009
100.679
-63.265
-38.59%
jan 1, 2010
78.096
-22.583
-22.43%
jan 1, 2011
38.194
-39.902
-51.09%
jan 1, 2012
43.53
+5.336
13.97%
jan 1, 2013
69.647
+26.117
60.0%
jan 1, 2014
48.688
-20.959
-30.09%
jan 1, 2015
75.268
+26.58
54.59%
jan 1, 2016
67.638
-7.63
-10.14%
Ranking of countries by current statistics by years


Comments: