29
/
en
AIzaSyAYiBZKx7MnpbEhh9jyipgxe19OcubqV5w
April 1, 2024
250324
St. Kitts and Nevis
KNA
true
2
1
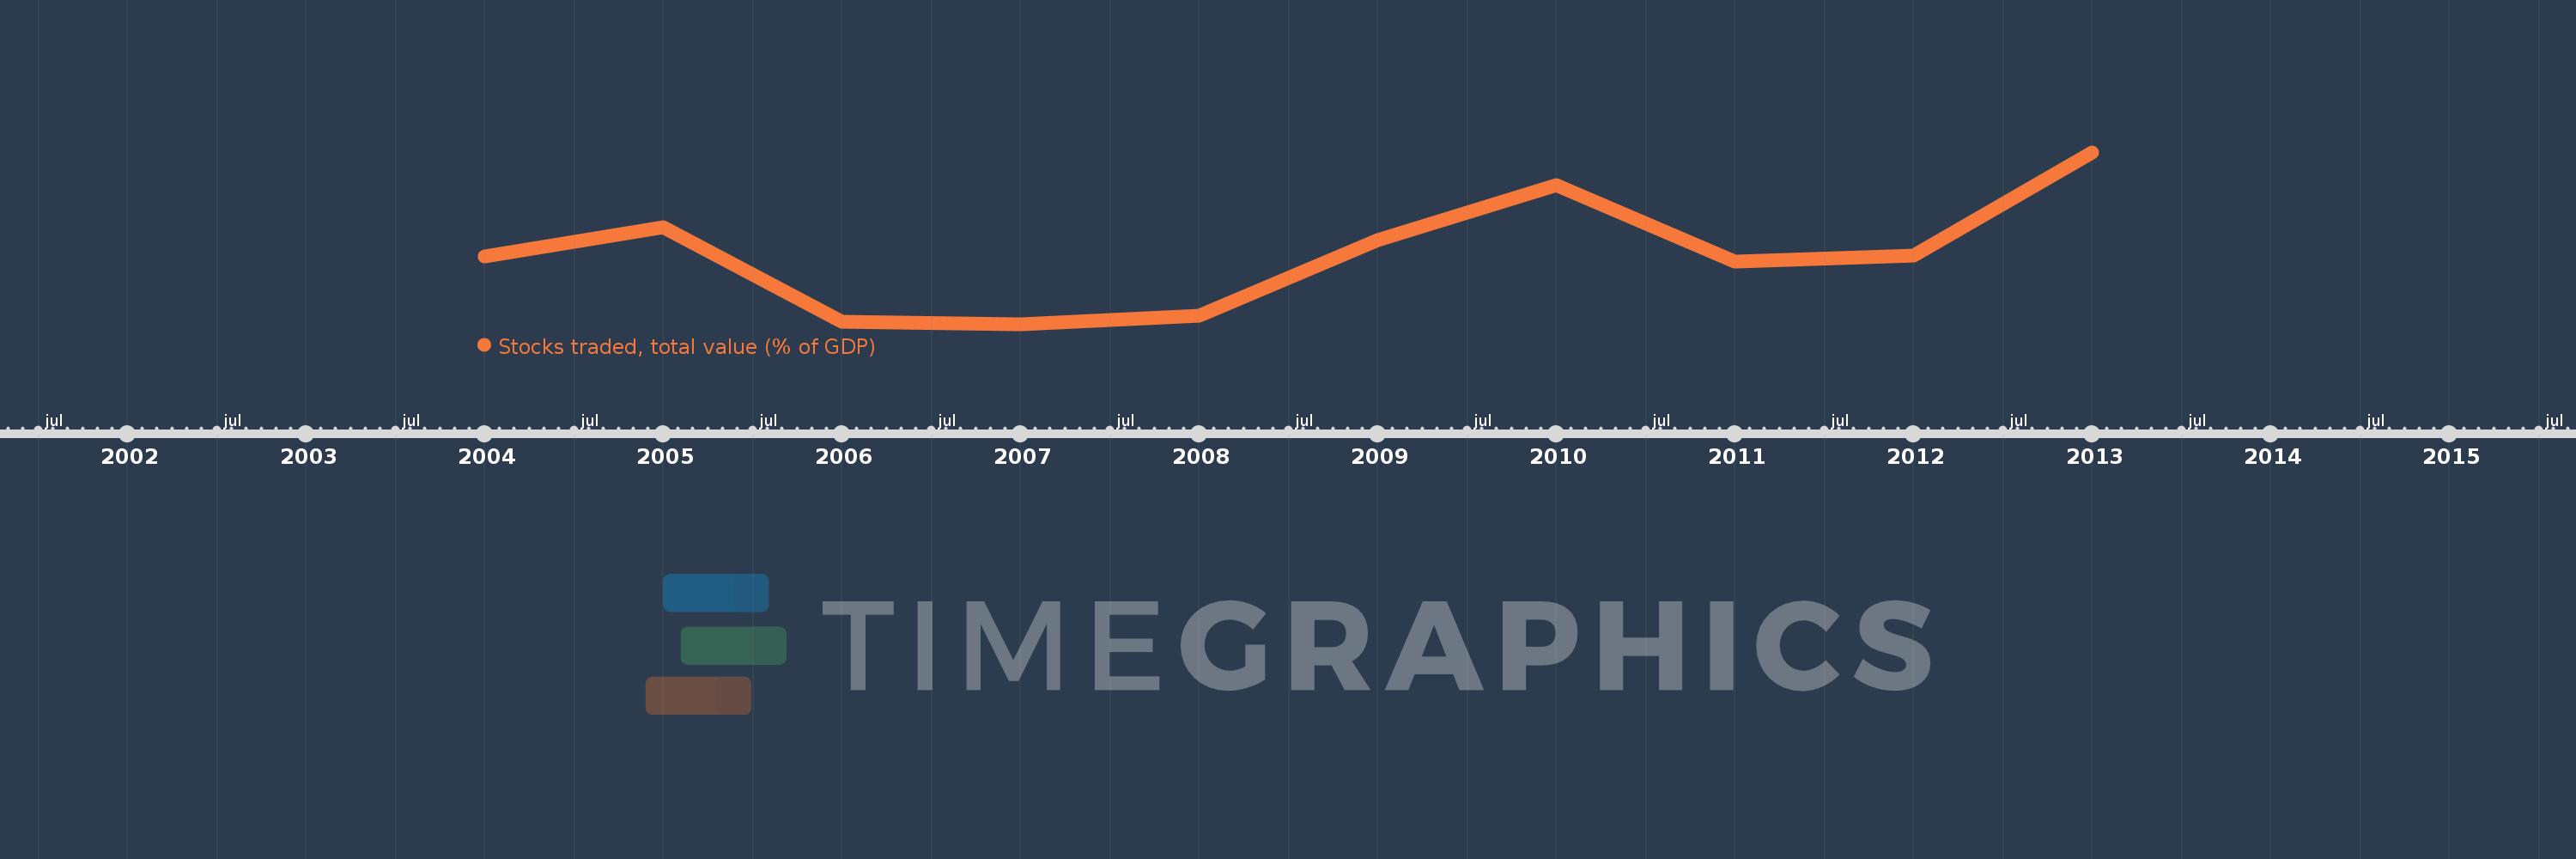
Stocks traded, total value (% of GDP)
2013,2012,2011,2010,2009,2008,2007,2006,2005,2004
This statistics in other country:
Timeline:
This timeline shows a graph from 2004 to 2013 of St. Kitts and Nevis. No data until 2003. Number of actual observations by date: 10.
Source name:
World Development Indicators
Source organization:
World Federation of Exchanges database.
Categories, topics:
Financial Sector
Last updated:
apr 23, 2017
Indicators value changes by year
At the date of observation
Value
Absolute change
Change from previous value
jan 1, 2004
0.701
+0.701
0.0%
jan 1, 2005
0.949
+0.248
35.39%
jan 1, 2006
0.15
-0.799
-84.21%
jan 1, 2007
0.129
-0.021
-14.13%
jan 1, 2008
0.204
+0.076
58.95%
jan 1, 2009
0.837
+0.633
309.41%
jan 1, 2010
1.302
+0.465
55.54%
jan 1, 2011
0.661
-0.641
-49.23%
jan 1, 2012
0.711
+0.05
7.51%
jan 1, 2013
1.58
+0.87
122.36%
Ranking of countries by current statistics by years


Comments: