29
/
en
AIzaSyAYiBZKx7MnpbEhh9jyipgxe19OcubqV5w
April 1, 2024
157982
Iran, Islamic Rep.
IRN
true
2
1
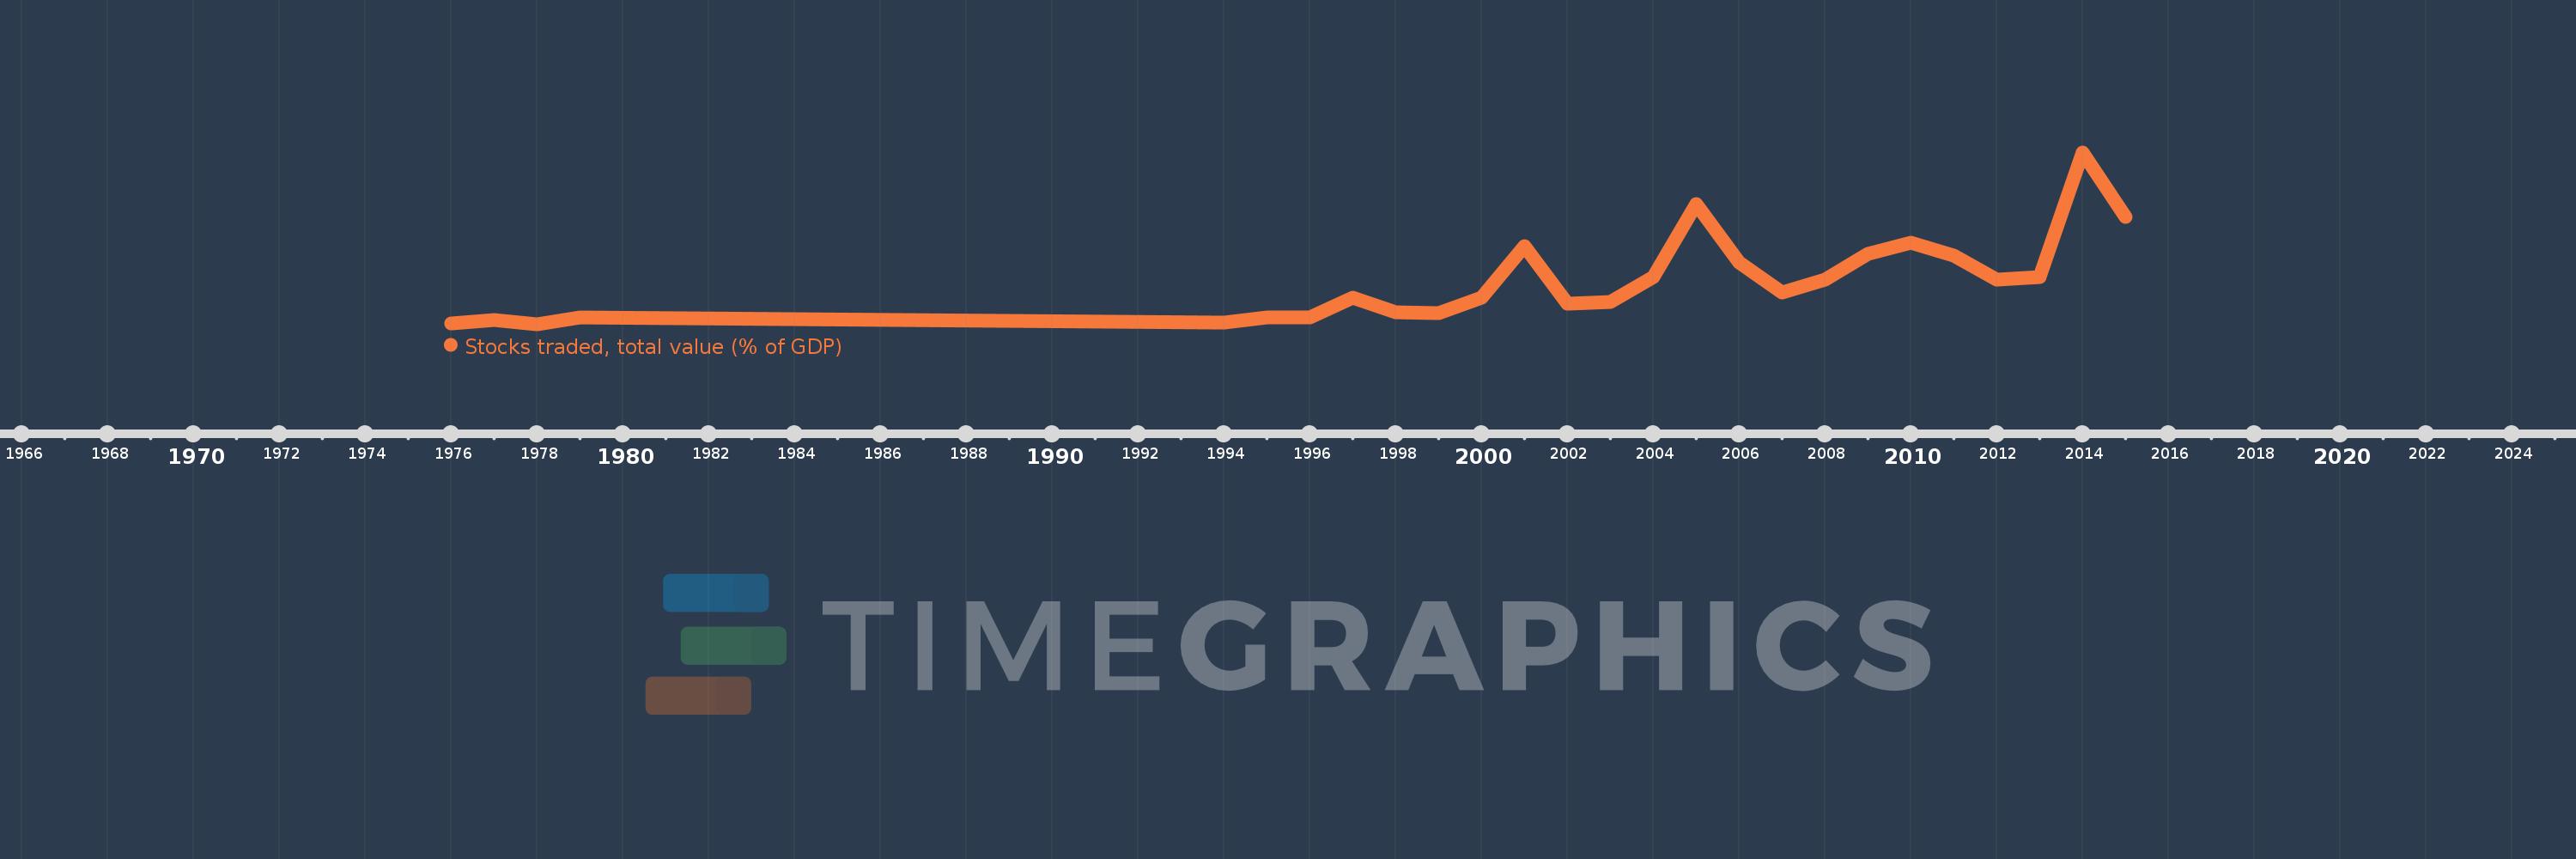
Stocks traded, total value (% of GDP)
2015,2014,2013,2012,2011,2010,2009,2008,2007,2006,2005,2004,2003,2002,2001,2000,1999,1998,1997,1996,1995,1994,1979,1978,1977,1976
This statistics in other country:
Timeline:
This timeline shows a graph from 1976 to 2015 of Iran, Islamic Rep.. No data until 1975. Number of actual observations by date: 26.
Source name:
World Development Indicators
Source organization:
World Federation of Exchanges database.
Categories, topics:
Financial Sector
Last updated:
apr 23, 2017
Indicators value changes by year
At the date of observation
Value
Absolute change
Change from previous value
jan 1, 1976
0.296
+0.296
0.0%
jan 1, 1977
0.441
+0.145
49.18%
jan 1, 1978
0.251
-0.19
-43.15%
jan 1, 1979
0.576
+0.325
129.7%
jan 1, 1994
0.333
-0.243
-42.24%
jan 1, 1995
0.602
+0.27
81.05%
jan 1, 1996
0.575
-0.027
-4.46%
jan 1, 1997
1.549
+0.974
169.32%
jan 1, 1998
0.845
-0.704
-45.47%
jan 1, 1999
0.79
-0.054
-6.42%
jan 1, 2000
1.559
+0.769
97.26%
jan 1, 2001
4.07
+2.511
161.06%
jan 1, 2002
1.235
-2.835
-69.65%
jan 1, 2003
1.354
+0.118
9.58%
jan 1, 2004
2.548
+1.195
88.27%
jan 1, 2005
6.128
+3.58
140.48%
jan 1, 2006
3.274
-2.854
-46.58%
jan 1, 2007
1.823
-1.451
-44.33%
jan 1, 2008
2.414
+0.592
32.46%
jan 1, 2009
3.68
+1.266
52.45%
jan 1, 2010
4.258
+0.578
15.69%
jan 1, 2011
3.631
-0.627
-14.72%
jan 1, 2012
2.434
-1.197
-32.98%
jan 1, 2013
2.565
+0.131
5.38%
jan 1, 2014
8.66
+6.095
237.63%
jan 1, 2015
5.494
-3.166
-36.56%
Ranking of countries by current statistics by years


Comments: