29
/
en
AIzaSyAYiBZKx7MnpbEhh9jyipgxe19OcubqV5w
April 1, 2024
276221
United Kingdom
GBR
true
2
1
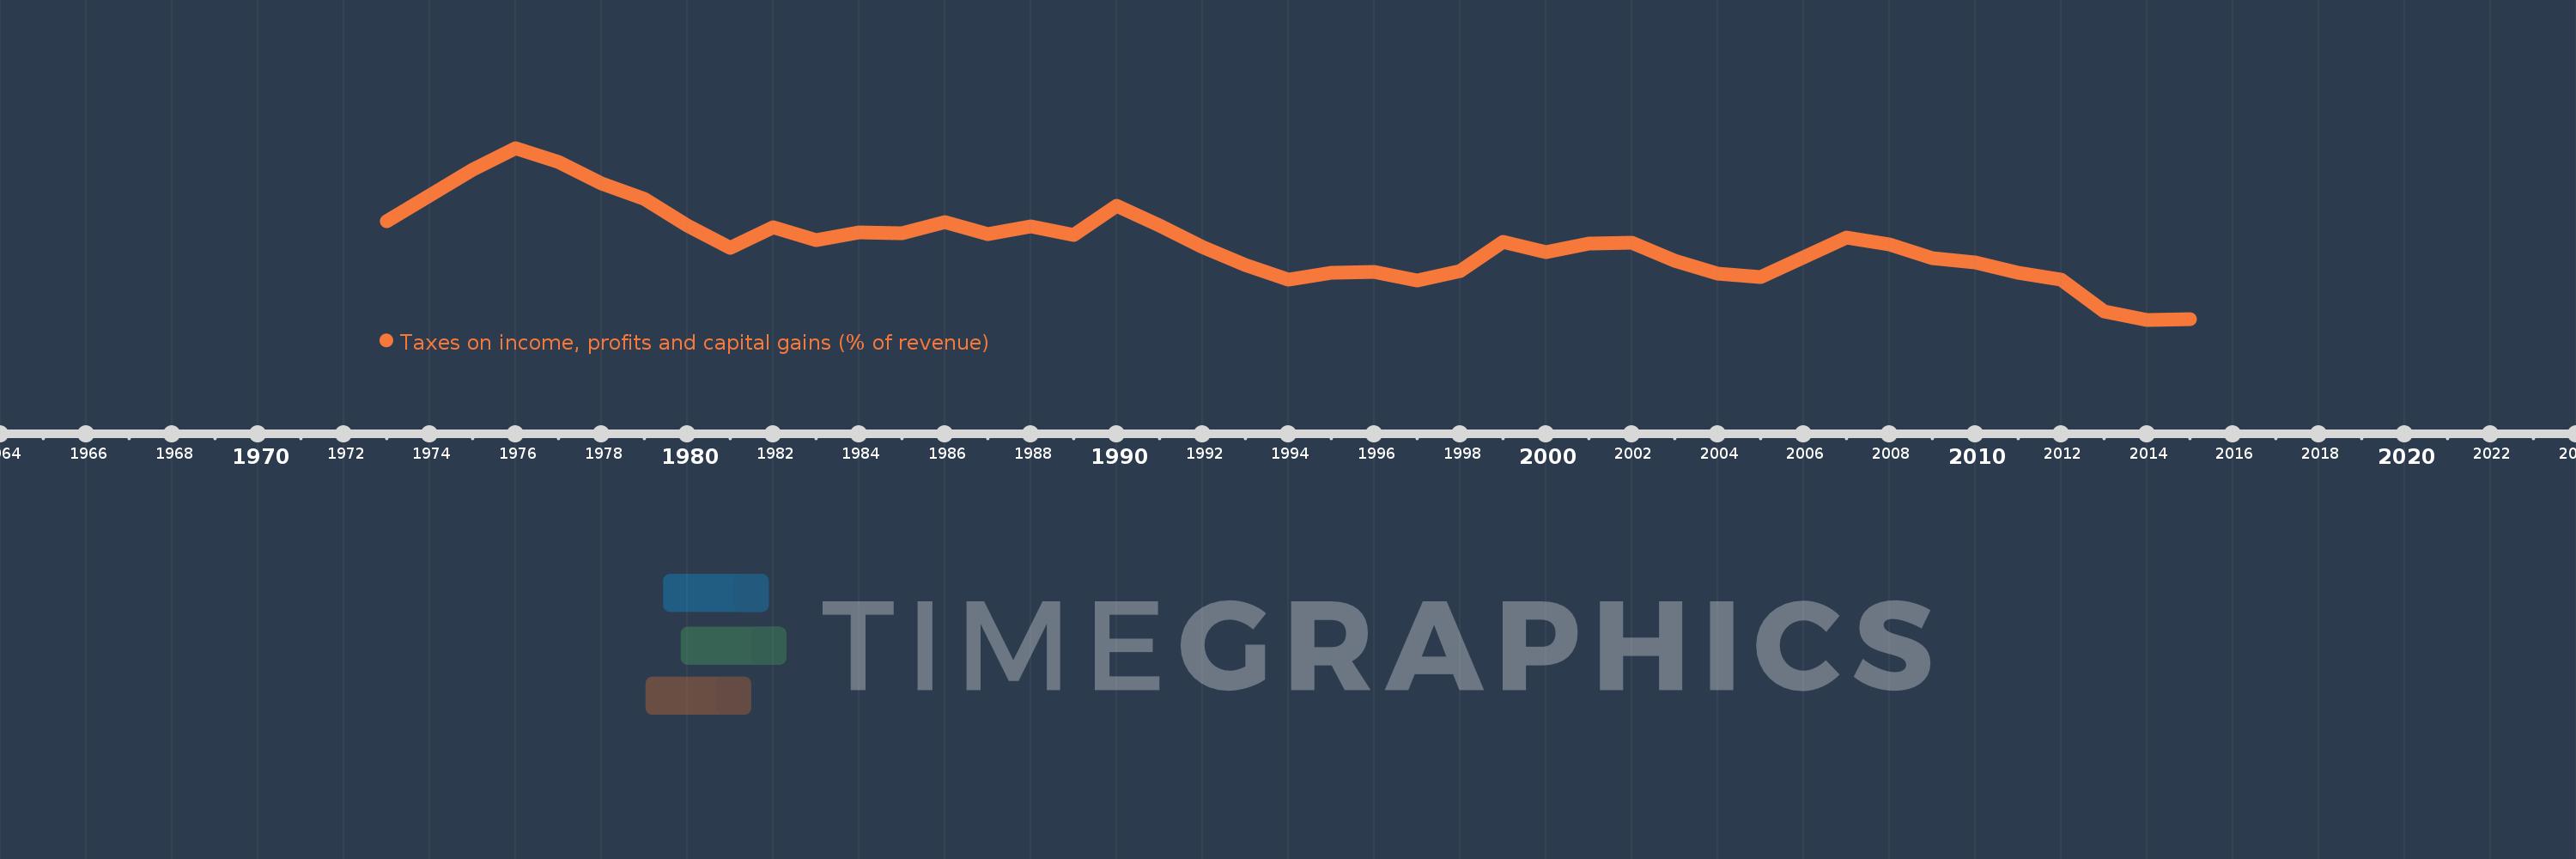
Taxes on income, profits and capital gains (% of revenue)
2015,2014,2013,2012,2011,2010,2009,2008,2007,2006,2005,2004,2003,2002,2001,2000,1999,1998,1997,1996,1995,1994,1993,1992,1991,1990,1989,1988,1987,1986,1985,1984,1983,1982,1981,1980,1979,1978,1977,1976,1975,1974,1973
This statistics in other country:
AfghanistanAlbaniaAlgeriaAngolaAntigua and BarbudaArab WorldArgentinaArmeniaAustraliaAustriaAzerbaijanBahrainBangladeshBarbadosBelarusBelgiumBelizeBeninBhutanBoliviaBosnia and HerzegovinaBotswanaBrazilBulgariaBurkina FasoBurundiCabo VerdeCambodiaCanadaCaribbean small statesCentral African RepublicCentral Europe and the BalticsChileChinaColombiaCongo, Dem. Rep.Congo, Rep.Costa RicaCote d'IvoireCroatiaCyprusCzech RepublicDenmarkDominicaDominican RepublicEarly-demographic dividendEast Asia & PacificEast Asia & Pacific (excluding high income)East Asia & Pacific (IDA & IBRD countries)Egypt, Arab Rep.El SalvadorEquatorial GuineaEstoniaEthiopiaEuro areaEurope & Central AsiaEurope & Central Asia (excluding high income)Europe & Central Asia (IDA & IBRD countries)European UnionFijiFinlandFranceGambia, TheGeorgiaGermanyGhanaGreeceGrenadaGuatemalaHeavily indebted poor countries (HIPC)High incomeHondurasHong Kong SAR, ChinaHungaryIBRD onlyIcelandIDA & IBRD totalIDA blendIDA onlyIDA totalIndiaIndonesiaIran, Islamic Rep.IraqIrelandIsraelItalyJamaicaJapanJordanKazakhstanKenyaKiribatiKorea, Rep.KuwaitKyrgyz RepublicLao PDRLate-demographic dividendLatin America & Caribbean Latin America & Caribbean (excluding high income)Latin America & the Caribbean (IDA & IBRD countries)LatviaLeast developed countries: UN classificationLebanonLesothoLiberiaLithuaniaLow & middle incomeLow incomeLower middle incomeLuxembourgMacao SAR, ChinaMacedonia, FYRMadagascarMalawiMalaysiaMaldivesMaliMaltaMauritiusMexicoMicronesia, Fed. Sts.Middle East & North AfricaMiddle East & North Africa (excluding high income)Middle East & North Africa (IDA & IBRD countries)Middle incomeMoldovaMongoliaMoroccoMozambiqueMyanmarNamibiaNepalNetherlandsNew ZealandNicaraguaNigeriaNorth AmericaNorwayOECD membersOmanOther small statesPakistanPanamaPapua New GuineaParaguayPeruPhilippinesPolandPortugalPost-demographic dividendPre-demographic dividendQatarRomaniaRussian FederationRwandaSamoaSan MarinoSao Tome and PrincipeSenegalSerbiaSeychellesSierra LeoneSingaporeSlovak RepublicSloveniaSmall statesSolomon IslandsSouth AfricaSouth AsiaSouth Asia (IDA & IBRD)SpainSri LankaSt. Kitts and NevisSt. LuciaSub-Saharan Africa Sub-Saharan Africa (excluding high income)Sub-Saharan Africa (IDA & IBRD countries)SurinameSwazilandSwedenSwitzerlandSyrian Arab RepublicTajikistanTanzaniaThailandTimor-LesteTogoTrinidad and TobagoTunisiaTurkeyUgandaUkraineUnited KingdomUnited StatesUpper middle incomeUruguayVenezuela, RBVietnamWest Bank and GazaWorldYemen, Rep.ZambiaZimbabwe Timeline:
This timeline shows a graph from 1973 to 2015 of United Kingdom. No data until 1972. Number of actual observations by date: 43.
Source name:
World Development Indicators
Source organization:
International Monetary Fund, Government Finance Statistics Yearbook and data files.
Categories, topics:
Public Sector
Last updated:
apr 23, 2017
Indicators value changes by year
Minimum:
32.589
jan 1, 2014
At the date of observation
Value
Absolute change
Change from previous value
jan 1, 1973
39.397
+39.397
0.0%
jan 1, 1974
41.122
+1.725
4.38%
jan 1, 1975
42.911
+1.788
4.35%
jan 1, 1976
44.42
+1.509
3.52%
jan 1, 1977
43.453
-0.967
-2.18%
jan 1, 1978
41.995
-1.458
-3.36%
jan 1, 1979
40.917
-1.077
-2.56%
jan 1, 1980
39.062
-1.855
-4.53%
jan 1, 1981
37.523
-1.539
-3.94%
jan 1, 1982
38.933
+1.41
3.76%
jan 1, 1983
38.098
-0.835
-2.14%
jan 1, 1984
38.593
+0.495
1.3%
jan 1, 1985
38.573
-0.02
-0.05%
jan 1, 1986
39.29
+0.717
1.86%
jan 1, 1987
38.489
-0.801
-2.04%
jan 1, 1988
39.039
+0.549
1.43%
jan 1, 1989
38.423
-0.616
-1.58%
jan 1, 1990
40.424
+2.001
5.21%
jan 1, 1991
39.05
-1.374
-3.4%
jan 1, 1992
37.581
-1.469
-3.76%
jan 1, 1993
36.352
-1.229
-3.27%
jan 1, 1994
35.352
-1.0
-2.75%
jan 1, 1995
35.834
+0.482
1.36%
jan 1, 1996
35.909
+0.075
0.21%
jan 1, 1997
35.303
-0.606
-1.69%
jan 1, 1998
35.915
+0.612
1.73%
jan 1, 1999
37.952
+2.038
5.67%
jan 1, 2000
37.261
-0.692
-1.82%
jan 1, 2001
37.845
+0.584
1.57%
jan 1, 2002
37.905
+0.06
0.16%
jan 1, 2003
36.659
-1.246
-3.29%
jan 1, 2004
35.754
-0.904
-2.47%
jan 1, 2005
35.539
-0.215
-0.6%
jan 1, 2006
36.915
+1.376
3.87%
jan 1, 2007
38.256
+1.34
3.63%
jan 1, 2008
37.754
-0.501
-1.31%
jan 1, 2009
36.841
-0.913
-2.42%
jan 1, 2010
36.56
-0.281
-0.76%
jan 1, 2011
35.851
-0.709
-1.94%
jan 1, 2012
35.356
-0.495
-1.38%
jan 1, 2013
33.183
-2.173
-6.15%
jan 1, 2014
32.589
-0.594
-1.79%
jan 1, 2015
32.634
+0.044
0.14%
Ranking of countries by current statistics by years


Comments: