29
/
en
AIzaSyAYiBZKx7MnpbEhh9jyipgxe19OcubqV5w
April 1, 2024
142383
Greece
GRC
true
2
1
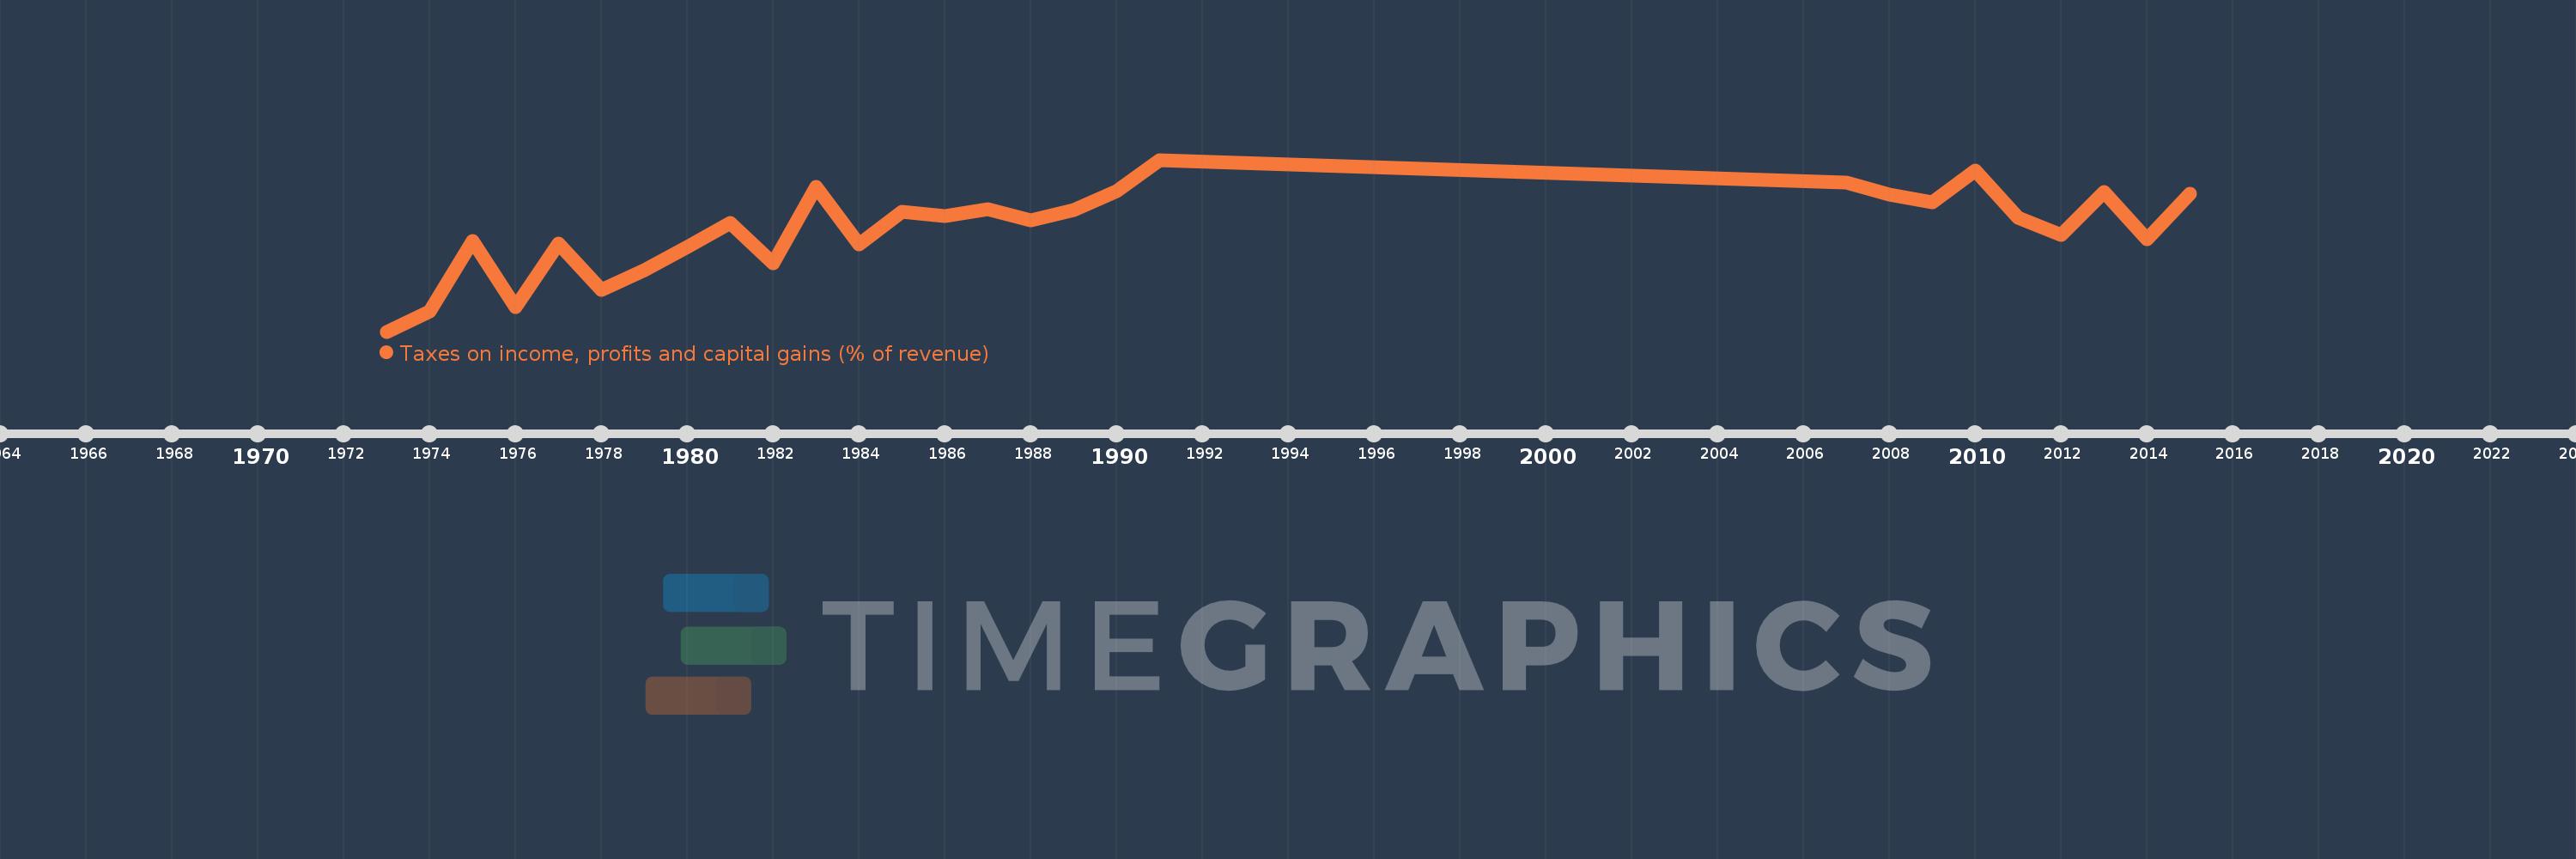
Taxes on income, profits and capital gains (% of revenue)
2015,2014,2013,2012,2011,2010,2009,2008,2007,1991,1990,1989,1988,1987,1986,1985,1984,1983,1982,1981,1980,1979,1978,1977,1976,1975,1974,1973
This statistics in other country:
AfghanistanAlbaniaAlgeriaAngolaAntigua and BarbudaArab WorldArgentinaArmeniaAustraliaAustriaAzerbaijanBahrainBangladeshBarbadosBelarusBelgiumBelizeBeninBhutanBoliviaBosnia and HerzegovinaBotswanaBrazilBulgariaBurkina FasoBurundiCabo VerdeCambodiaCanadaCaribbean small statesCentral African RepublicCentral Europe and the BalticsChileChinaColombiaCongo, Dem. Rep.Congo, Rep.Costa RicaCote d'IvoireCroatiaCyprusCzech RepublicDenmarkDominicaDominican RepublicEarly-demographic dividendEast Asia & PacificEast Asia & Pacific (excluding high income)East Asia & Pacific (IDA & IBRD countries)Egypt, Arab Rep.El SalvadorEquatorial GuineaEstoniaEthiopiaEuro areaEurope & Central AsiaEurope & Central Asia (excluding high income)Europe & Central Asia (IDA & IBRD countries)European UnionFijiFinlandFranceGambia, TheGeorgiaGermanyGhanaGreeceGrenadaGuatemalaHeavily indebted poor countries (HIPC)High incomeHondurasHong Kong SAR, ChinaHungaryIBRD onlyIcelandIDA & IBRD totalIDA blendIDA onlyIDA totalIndiaIndonesiaIran, Islamic Rep.IraqIrelandIsraelItalyJamaicaJapanJordanKazakhstanKenyaKiribatiKorea, Rep.KuwaitKyrgyz RepublicLao PDRLate-demographic dividendLatin America & Caribbean Latin America & Caribbean (excluding high income)Latin America & the Caribbean (IDA & IBRD countries)LatviaLeast developed countries: UN classificationLebanonLesothoLiberiaLithuaniaLow & middle incomeLow incomeLower middle incomeLuxembourgMacao SAR, ChinaMacedonia, FYRMadagascarMalawiMalaysiaMaldivesMaliMaltaMauritiusMexicoMicronesia, Fed. Sts.Middle East & North AfricaMiddle East & North Africa (excluding high income)Middle East & North Africa (IDA & IBRD countries)Middle incomeMoldovaMongoliaMoroccoMozambiqueMyanmarNamibiaNepalNetherlandsNew ZealandNicaraguaNigeriaNorth AmericaNorwayOECD membersOmanOther small statesPakistanPanamaPapua New GuineaParaguayPeruPhilippinesPolandPortugalPost-demographic dividendPre-demographic dividendQatarRomaniaRussian FederationRwandaSamoaSan MarinoSao Tome and PrincipeSenegalSerbiaSeychellesSierra LeoneSingaporeSlovak RepublicSloveniaSmall statesSolomon IslandsSouth AfricaSouth AsiaSouth Asia (IDA & IBRD)SpainSri LankaSt. Kitts and NevisSt. LuciaSub-Saharan Africa Sub-Saharan Africa (excluding high income)Sub-Saharan Africa (IDA & IBRD countries)SurinameSwazilandSwedenSwitzerlandSyrian Arab RepublicTajikistanTanzaniaThailandTimor-LesteTogoTrinidad and TobagoTunisiaTurkeyUgandaUkraineUnited KingdomUnited StatesUpper middle incomeUruguayVenezuela, RBVietnamWest Bank and GazaWorldYemen, Rep.ZambiaZimbabwe Timeline:
This timeline shows a graph from 1973 to 2015 of Greece. No data until 1972. Number of actual observations by date: 28.
Source name:
World Development Indicators
Source organization:
International Monetary Fund, Government Finance Statistics Yearbook and data files.
Categories, topics:
Public Sector
Last updated:
apr 23, 2017
Indicators value changes by year
Minimum:
12.164
jan 1, 1973
Maximum:
20.419
jan 1, 1991
At the date of observation
Value
Absolute change
Change from previous value
jan 1, 1973
12.164
+12.164
0.0%
jan 1, 1974
13.126
+0.963
7.91%
jan 1, 1975
16.511
+3.385
25.79%
jan 1, 1976
13.324
-3.187
-19.3%
jan 1, 1977
16.39
+3.066
23.01%
jan 1, 1978
14.168
-2.222
-13.56%
jan 1, 1979
15.129
+0.961
6.78%
jan 1, 1980
16.222
+1.093
7.23%
jan 1, 1981
17.389
+1.167
7.2%
jan 1, 1982
15.452
-1.937
-11.14%
jan 1, 1983
19.137
+3.685
23.84%
jan 1, 1984
16.361
-2.776
-14.51%
jan 1, 1985
17.938
+1.577
9.64%
jan 1, 1986
17.707
-0.231
-1.29%
jan 1, 1987
18.027
+0.321
1.81%
jan 1, 1988
17.496
-0.531
-2.94%
jan 1, 1989
18.025
+0.528
3.02%
jan 1, 1990
18.918
+0.893
4.96%
jan 1, 1991
20.419
+1.501
7.94%
jan 1, 2007
19.321
-1.099
-5.38%
jan 1, 2008
18.737
-0.583
-3.02%
jan 1, 2009
18.387
-0.35
-1.87%
jan 1, 2010
19.893
+1.506
8.19%
jan 1, 2011
17.617
-2.276
-11.44%
jan 1, 2012
16.821
-0.796
-4.52%
jan 1, 2013
18.881
+2.06
12.25%
jan 1, 2014
16.59
-2.291
-12.13%
jan 1, 2015
18.798
+2.208
13.31%
Ranking of countries by current statistics by years


Comments: