29
/
en
AIzaSyAYiBZKx7MnpbEhh9jyipgxe19OcubqV5w
April 1, 2024
270123
Turkey
TUR
true
2
1
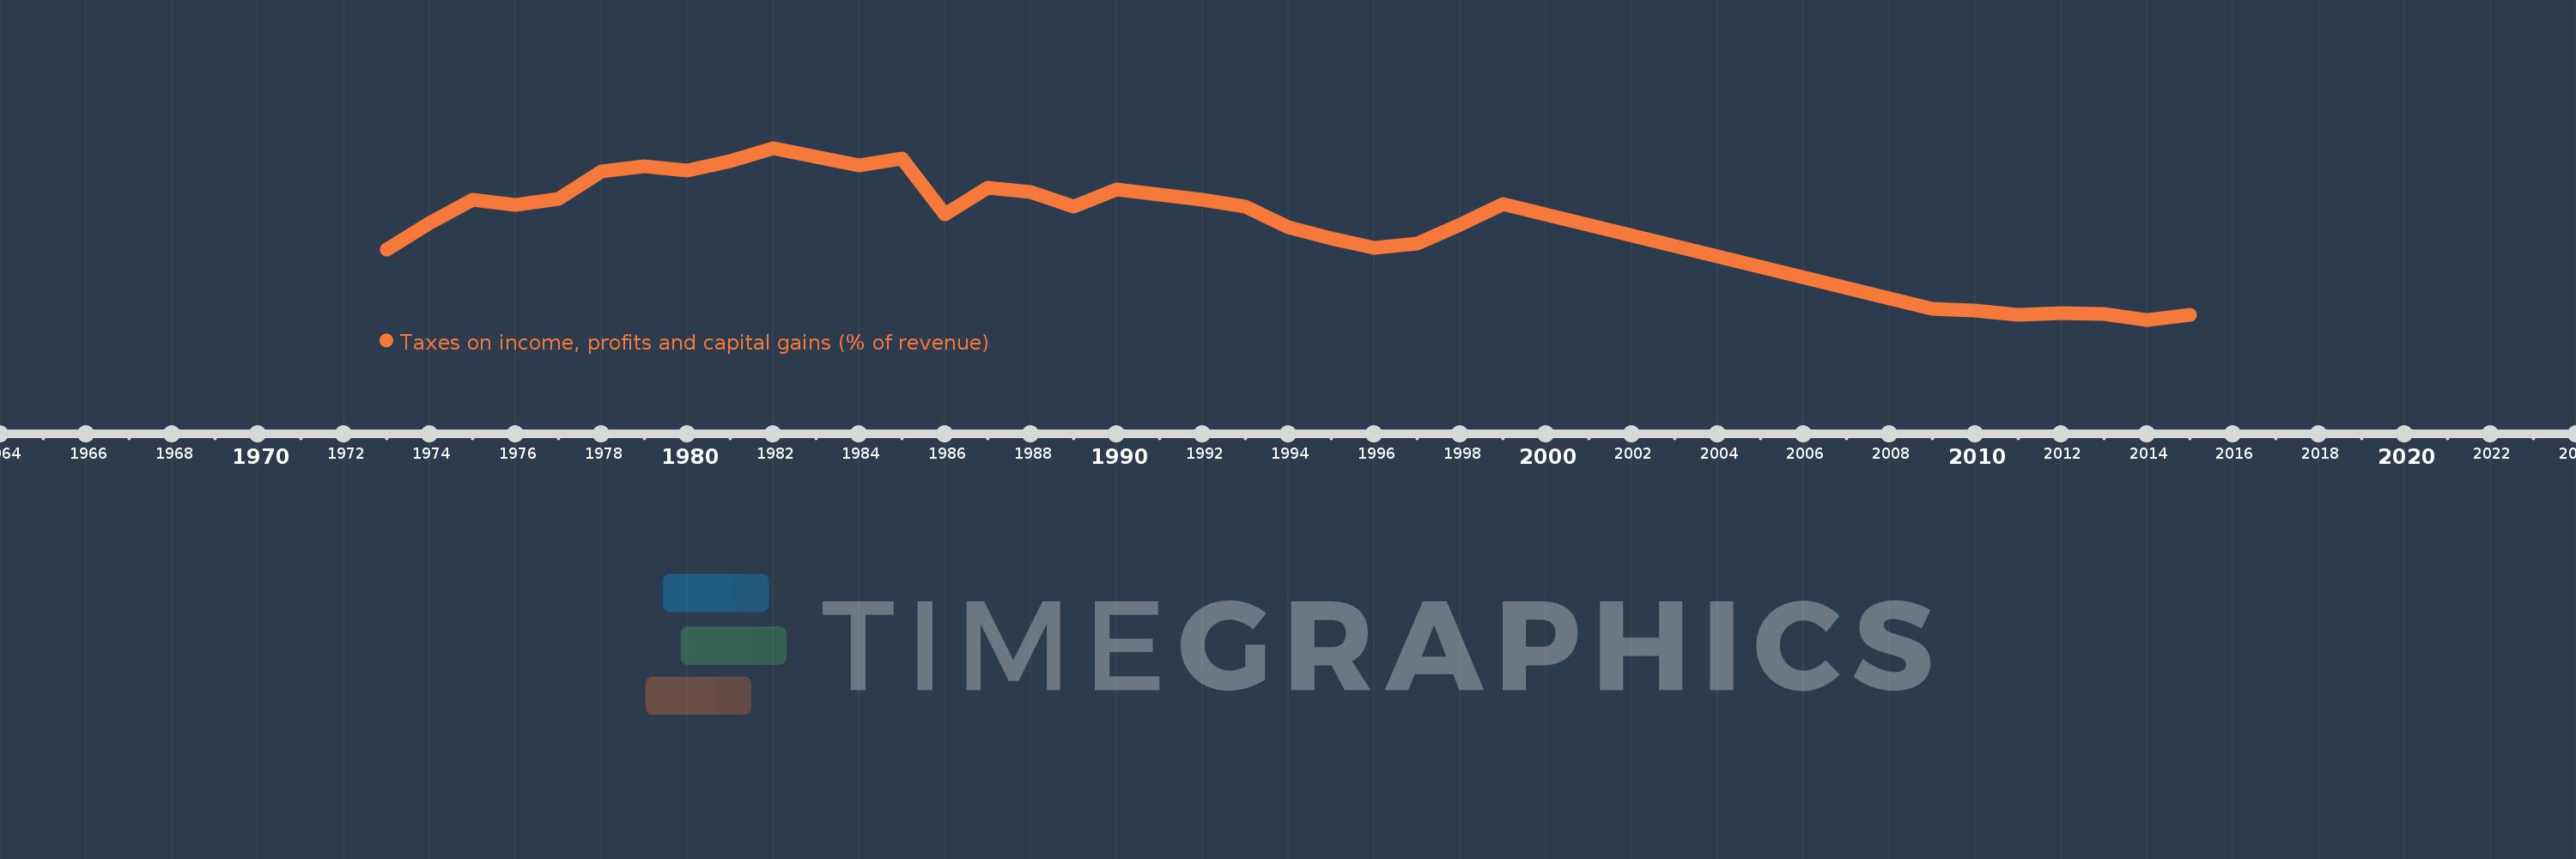
Taxes on income, profits and capital gains (% of revenue)
2015,2014,2013,2012,2011,2010,2009,1999,1998,1997,1996,1995,1994,1993,1992,1991,1990,1989,1988,1987,1986,1985,1984,1982,1981,1980,1979,1978,1977,1976,1975,1974,1973
This statistics in other country:
AfghanistanAlbaniaAlgeriaAngolaAntigua and BarbudaArab WorldArgentinaArmeniaAustraliaAustriaAzerbaijanBahrainBangladeshBarbadosBelarusBelgiumBelizeBeninBhutanBoliviaBosnia and HerzegovinaBotswanaBrazilBulgariaBurkina FasoBurundiCabo VerdeCambodiaCanadaCaribbean small statesCentral African RepublicCentral Europe and the BalticsChileChinaColombiaCongo, Dem. Rep.Congo, Rep.Costa RicaCote d'IvoireCroatiaCyprusCzech RepublicDenmarkDominicaDominican RepublicEarly-demographic dividendEast Asia & PacificEast Asia & Pacific (excluding high income)East Asia & Pacific (IDA & IBRD countries)Egypt, Arab Rep.El SalvadorEquatorial GuineaEstoniaEthiopiaEuro areaEurope & Central AsiaEurope & Central Asia (excluding high income)Europe & Central Asia (IDA & IBRD countries)European UnionFijiFinlandFranceGambia, TheGeorgiaGermanyGhanaGreeceGrenadaGuatemalaHeavily indebted poor countries (HIPC)High incomeHondurasHong Kong SAR, ChinaHungaryIBRD onlyIcelandIDA & IBRD totalIDA blendIDA onlyIDA totalIndiaIndonesiaIran, Islamic Rep.IraqIrelandIsraelItalyJamaicaJapanJordanKazakhstanKenyaKiribatiKorea, Rep.KuwaitKyrgyz RepublicLao PDRLate-demographic dividendLatin America & Caribbean Latin America & Caribbean (excluding high income)Latin America & the Caribbean (IDA & IBRD countries)LatviaLeast developed countries: UN classificationLebanonLesothoLiberiaLithuaniaLow & middle incomeLow incomeLower middle incomeLuxembourgMacao SAR, ChinaMacedonia, FYRMadagascarMalawiMalaysiaMaldivesMaliMaltaMauritiusMexicoMicronesia, Fed. Sts.Middle East & North AfricaMiddle East & North Africa (excluding high income)Middle East & North Africa (IDA & IBRD countries)Middle incomeMoldovaMongoliaMoroccoMozambiqueMyanmarNamibiaNepalNetherlandsNew ZealandNicaraguaNigeriaNorth AmericaNorwayOECD membersOmanOther small statesPakistanPanamaPapua New GuineaParaguayPeruPhilippinesPolandPortugalPost-demographic dividendPre-demographic dividendQatarRomaniaRussian FederationRwandaSamoaSan MarinoSao Tome and PrincipeSenegalSerbiaSeychellesSierra LeoneSingaporeSlovak RepublicSloveniaSmall statesSolomon IslandsSouth AfricaSouth AsiaSouth Asia (IDA & IBRD)SpainSri LankaSt. Kitts and NevisSt. LuciaSub-Saharan Africa Sub-Saharan Africa (excluding high income)Sub-Saharan Africa (IDA & IBRD countries)SurinameSwazilandSwedenSwitzerlandSyrian Arab RepublicTajikistanTanzaniaThailandTimor-LesteTogoTrinidad and TobagoTunisiaTurkeyUgandaUkraineUnited KingdomUnited StatesUpper middle incomeUruguayVenezuela, RBVietnamWest Bank and GazaWorldYemen, Rep.ZambiaZimbabwe Timeline:
This timeline shows a graph from 1973 to 2015 of Turkey. No data until 1972. Number of actual observations by date: 33.
Source name:
World Development Indicators
Source organization:
International Monetary Fund, Government Finance Statistics Yearbook and data files.
Categories, topics:
Public Sector
Last updated:
apr 23, 2017
Indicators value changes by year
Minimum:
16.329
jan 1, 2014
Maximum:
51.673
jan 1, 1982
At the date of observation
Value
Absolute change
Change from previous value
jan 1, 1973
30.802
+30.802
0.0%
jan 1, 1974
36.256
+5.455
17.71%
jan 1, 1975
41.061
+4.805
13.25%
jan 1, 1976
39.982
-1.08
-2.63%
jan 1, 1977
41.267
+1.285
3.21%
jan 1, 1978
46.923
+5.657
13.71%
jan 1, 1979
47.838
+0.915
1.95%
jan 1, 1980
46.95
-0.888
-1.86%
jan 1, 1981
49.053
+2.103
4.48%
jan 1, 1982
51.673
+2.62
5.34%
jan 1, 1984
48.173
-3.5
-6.77%
jan 1, 1985
49.449
+1.276
2.65%
jan 1, 1986
37.99
-11.459
-23.17%
jan 1, 1987
43.512
+5.522
14.54%
jan 1, 1988
42.595
-0.917
-2.11%
jan 1, 1989
39.547
-3.048
-7.16%
jan 1, 1990
43.167
+3.621
9.16%
jan 1, 1991
42.028
-1.139
-2.64%
jan 1, 1992
41.019
-1.01
-2.4%
jan 1, 1993
39.564
-1.455
-3.55%
jan 1, 1994
35.395
-4.169
-10.54%
jan 1, 1995
33.055
-2.341
-6.61%
jan 1, 1996
31.143
-1.911
-5.78%
jan 1, 1997
31.943
+0.799
2.57%
jan 1, 1998
35.896
+3.953
12.38%
jan 1, 1999
40.177
+4.281
11.93%
jan 1, 2009
18.636
-21.541
-53.61%
jan 1, 2010
18.224
-0.412
-2.21%
jan 1, 2011
17.407
-0.817
-4.48%
jan 1, 2012
17.664
+0.257
1.47%
jan 1, 2013
17.551
-0.112
-0.64%
jan 1, 2014
16.329
-1.222
-6.97%
jan 1, 2015
17.378
+1.049
6.42%
Ranking of countries by current statistics by years


Comments: