29
/
en
AIzaSyAYiBZKx7MnpbEhh9jyipgxe19OcubqV5w
April 1, 2024
30330
Euro area
EMU
false
2
1
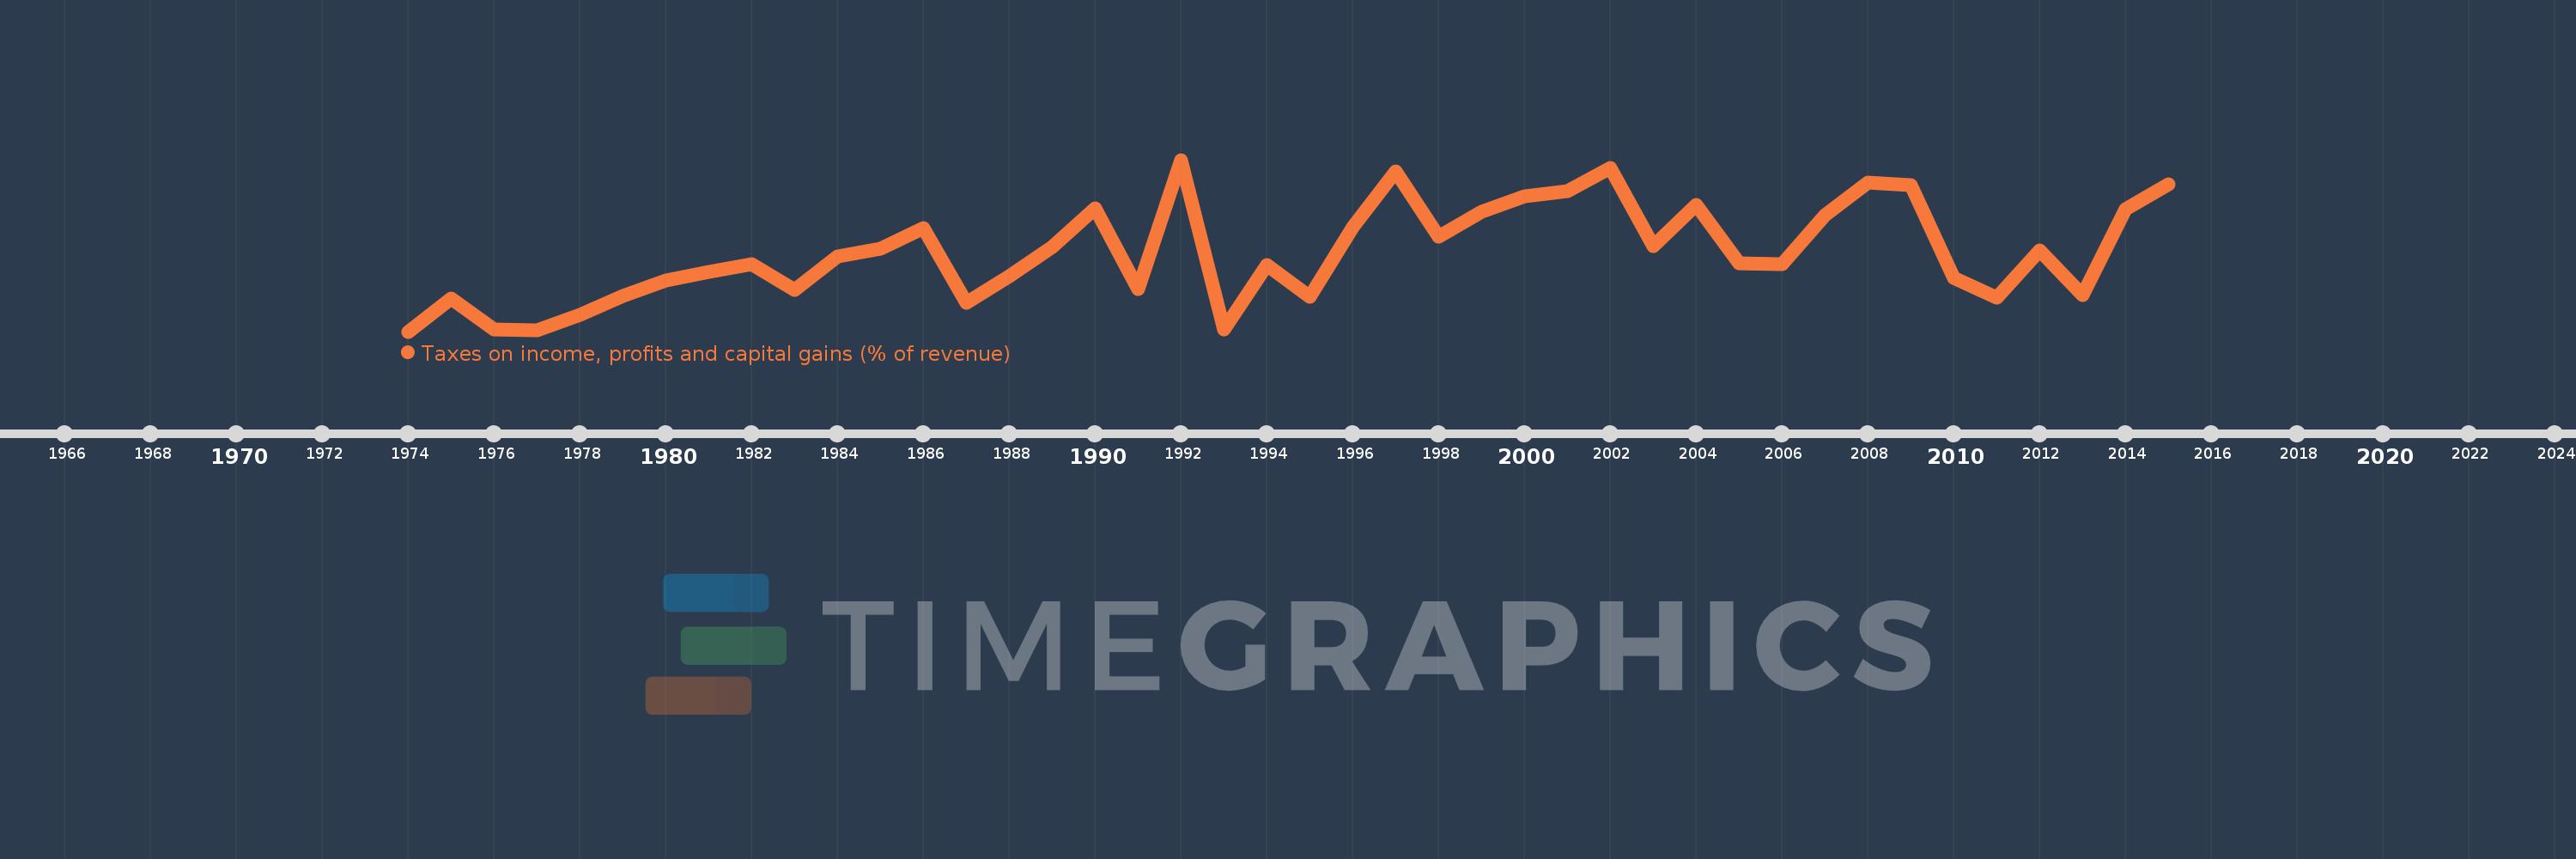
Taxes on income, profits and capital gains (% of revenue)
2015,2014,2013,2012,2011,2010,2009,2008,2007,2006,2005,2004,2003,2002,2001,2000,1999,1998,1997,1996,1995,1994,1993,1992,1991,1990,1989,1988,1987,1986,1985,1984,1983,1982,1981,1980,1979,1978,1977,1976,1975,1974
This statistics in other country:
AfghanistanAlbaniaAlgeriaAngolaAntigua and BarbudaArab WorldArgentinaArmeniaAustraliaAustriaAzerbaijanBahrainBangladeshBarbadosBelarusBelgiumBelizeBeninBhutanBoliviaBosnia and HerzegovinaBotswanaBrazilBulgariaBurkina FasoBurundiCabo VerdeCambodiaCanadaCaribbean small statesCentral African RepublicCentral Europe and the BalticsChileChinaColombiaCongo, Dem. Rep.Congo, Rep.Costa RicaCote d'IvoireCroatiaCyprusCzech RepublicDenmarkDominicaDominican RepublicEarly-demographic dividendEast Asia & PacificEast Asia & Pacific (excluding high income)East Asia & Pacific (IDA & IBRD countries)Egypt, Arab Rep.El SalvadorEquatorial GuineaEstoniaEthiopiaEuro areaEurope & Central AsiaEurope & Central Asia (excluding high income)Europe & Central Asia (IDA & IBRD countries)European UnionFijiFinlandFranceGambia, TheGeorgiaGermanyGhanaGreeceGrenadaGuatemalaHeavily indebted poor countries (HIPC)High incomeHondurasHong Kong SAR, ChinaHungaryIBRD onlyIcelandIDA & IBRD totalIDA blendIDA onlyIDA totalIndiaIndonesiaIran, Islamic Rep.IraqIrelandIsraelItalyJamaicaJapanJordanKazakhstanKenyaKiribatiKorea, Rep.KuwaitKyrgyz RepublicLao PDRLate-demographic dividendLatin America & Caribbean Latin America & Caribbean (excluding high income)Latin America & the Caribbean (IDA & IBRD countries)LatviaLeast developed countries: UN classificationLebanonLesothoLiberiaLithuaniaLow & middle incomeLow incomeLower middle incomeLuxembourgMacao SAR, ChinaMacedonia, FYRMadagascarMalawiMalaysiaMaldivesMaliMaltaMauritiusMexicoMicronesia, Fed. Sts.Middle East & North AfricaMiddle East & North Africa (excluding high income)Middle East & North Africa (IDA & IBRD countries)Middle incomeMoldovaMongoliaMoroccoMozambiqueMyanmarNamibiaNepalNetherlandsNew ZealandNicaraguaNigeriaNorth AmericaNorwayOECD membersOmanOther small statesPakistanPanamaPapua New GuineaParaguayPeruPhilippinesPolandPortugalPost-demographic dividendPre-demographic dividendQatarRomaniaRussian FederationRwandaSamoaSan MarinoSao Tome and PrincipeSenegalSerbiaSeychellesSierra LeoneSingaporeSlovak RepublicSloveniaSmall statesSolomon IslandsSouth AfricaSouth AsiaSouth Asia (IDA & IBRD)SpainSri LankaSt. Kitts and NevisSt. LuciaSub-Saharan Africa Sub-Saharan Africa (excluding high income)Sub-Saharan Africa (IDA & IBRD countries)SurinameSwazilandSwedenSwitzerlandSyrian Arab RepublicTajikistanTanzaniaThailandTimor-LesteTogoTrinidad and TobagoTunisiaTurkeyUgandaUkraineUnited KingdomUnited StatesUpper middle incomeUruguayVenezuela, RBVietnamWest Bank and GazaWorldYemen, Rep.ZambiaZimbabwe Timeline:
This timeline shows a graph from 1974 to 2015 of Euro area. No data until 1973. Number of actual observations by date: 42.
Source name:
World Development Indicators
Source organization:
International Monetary Fund, Government Finance Statistics Yearbook and data files.
Categories, topics:
Public Sector
Last updated:
apr 23, 2017
Indicators value changes by year
Minimum:
19.872
jan 1, 1974
Maximum:
25.984
jan 1, 1992
At the date of observation
Value
Absolute change
Change from previous value
jan 1, 1974
19.872
+19.872
0.0%
jan 1, 1975
21.04
+1.168
5.88%
jan 1, 1976
19.955
-1.085
-5.16%
jan 1, 1977
19.91
-0.045
-0.23%
jan 1, 1978
20.456
+0.546
2.74%
jan 1, 1979
21.146
+0.691
3.38%
jan 1, 1980
21.683
+0.537
2.54%
jan 1, 1981
21.998
+0.315
1.45%
jan 1, 1982
22.279
+0.281
1.28%
jan 1, 1983
21.345
-0.935
-4.19%
jan 1, 1984
22.543
+1.199
5.62%
jan 1, 1985
22.819
+0.275
1.22%
jan 1, 1986
23.544
+0.725
3.18%
jan 1, 1987
20.893
-2.65
-11.26%
jan 1, 1988
21.836
+0.942
4.51%
jan 1, 1989
22.872
+1.037
4.75%
jan 1, 1990
24.254
+1.381
6.04%
jan 1, 1991
21.389
-2.864
-11.81%
jan 1, 1992
25.984
+4.594
21.48%
jan 1, 1993
19.952
-6.032
-23.21%
jan 1, 1994
22.252
+2.3
11.53%
jan 1, 1995
21.124
-1.128
-5.07%
jan 1, 1996
23.592
+2.468
11.68%
jan 1, 1997
25.574
+1.982
8.4%
jan 1, 1998
23.239
-2.334
-9.13%
jan 1, 1999
24.136
+0.897
3.86%
jan 1, 2000
24.688
+0.552
2.29%
jan 1, 2001
24.855
+0.167
0.68%
jan 1, 2002
25.685
+0.83
3.34%
jan 1, 2003
22.91
-2.775
-10.81%
jan 1, 2004
24.382
+1.472
6.42%
jan 1, 2005
22.306
-2.076
-8.51%
jan 1, 2006
22.285
-0.021
-0.09%
jan 1, 2007
24.02
+1.735
7.78%
jan 1, 2008
25.161
+1.141
4.75%
jan 1, 2009
25.09
-0.071
-0.28%
jan 1, 2010
21.772
-3.318
-13.22%
jan 1, 2011
21.085
-0.687
-3.16%
jan 1, 2012
22.769
+1.684
7.99%
jan 1, 2013
21.186
-1.583
-6.95%
jan 1, 2014
24.226
+3.041
14.35%
jan 1, 2015
25.112
+0.885
3.65%
Ranking of countries by current statistics by years


Comments: