29
/
en
AIzaSyAYiBZKx7MnpbEhh9jyipgxe19OcubqV5w
April 1, 2024
73499
Australia
AUS
true
2
1
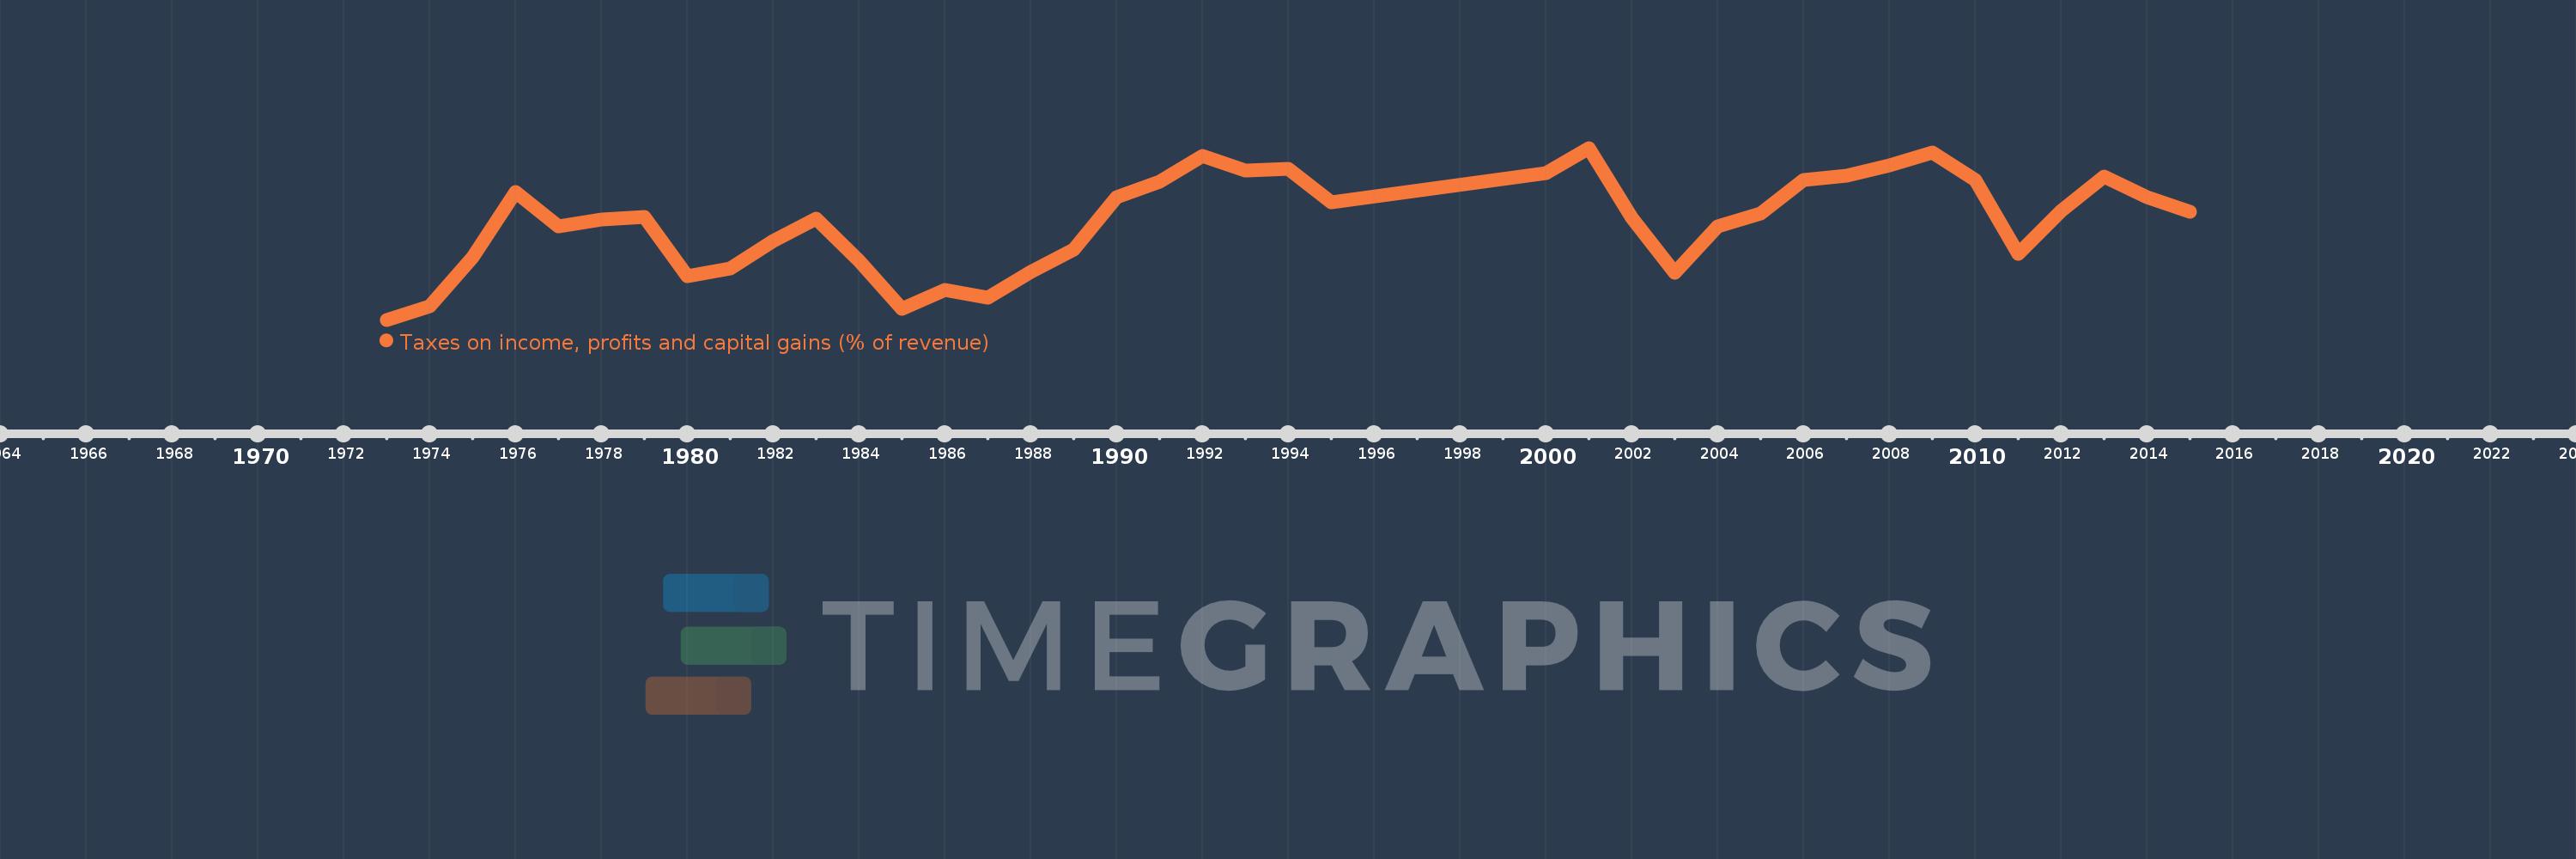
Taxes on income, profits and capital gains (% of revenue)
2015,2014,2013,2012,2011,2010,2009,2008,2007,2006,2005,2004,2003,2002,2001,2000,1995,1994,1993,1992,1991,1990,1989,1988,1987,1986,1985,1984,1983,1982,1981,1980,1979,1978,1977,1976,1975,1974,1973
This statistics in other country:
AfghanistanAlbaniaAlgeriaAngolaAntigua and BarbudaArab WorldArgentinaArmeniaAustraliaAustriaAzerbaijanBahrainBangladeshBarbadosBelarusBelgiumBelizeBeninBhutanBoliviaBosnia and HerzegovinaBotswanaBrazilBulgariaBurkina FasoBurundiCabo VerdeCambodiaCanadaCaribbean small statesCentral African RepublicCentral Europe and the BalticsChileChinaColombiaCongo, Dem. Rep.Congo, Rep.Costa RicaCote d'IvoireCroatiaCyprusCzech RepublicDenmarkDominicaDominican RepublicEarly-demographic dividendEast Asia & PacificEast Asia & Pacific (excluding high income)East Asia & Pacific (IDA & IBRD countries)Egypt, Arab Rep.El SalvadorEquatorial GuineaEstoniaEthiopiaEuro areaEurope & Central AsiaEurope & Central Asia (excluding high income)Europe & Central Asia (IDA & IBRD countries)European UnionFijiFinlandFranceGambia, TheGeorgiaGermanyGhanaGreeceGrenadaGuatemalaHeavily indebted poor countries (HIPC)High incomeHondurasHong Kong SAR, ChinaHungaryIBRD onlyIcelandIDA & IBRD totalIDA blendIDA onlyIDA totalIndiaIndonesiaIran, Islamic Rep.IraqIrelandIsraelItalyJamaicaJapanJordanKazakhstanKenyaKiribatiKorea, Rep.KuwaitKyrgyz RepublicLao PDRLate-demographic dividendLatin America & Caribbean Latin America & Caribbean (excluding high income)Latin America & the Caribbean (IDA & IBRD countries)LatviaLeast developed countries: UN classificationLebanonLesothoLiberiaLithuaniaLow & middle incomeLow incomeLower middle incomeLuxembourgMacao SAR, ChinaMacedonia, FYRMadagascarMalawiMalaysiaMaldivesMaliMaltaMauritiusMexicoMicronesia, Fed. Sts.Middle East & North AfricaMiddle East & North Africa (excluding high income)Middle East & North Africa (IDA & IBRD countries)Middle incomeMoldovaMongoliaMoroccoMozambiqueMyanmarNamibiaNepalNetherlandsNew ZealandNicaraguaNigeriaNorth AmericaNorwayOECD membersOmanOther small statesPakistanPanamaPapua New GuineaParaguayPeruPhilippinesPolandPortugalPost-demographic dividendPre-demographic dividendQatarRomaniaRussian FederationRwandaSamoaSan MarinoSao Tome and PrincipeSenegalSerbiaSeychellesSierra LeoneSingaporeSlovak RepublicSloveniaSmall statesSolomon IslandsSouth AfricaSouth AsiaSouth Asia (IDA & IBRD)SpainSri LankaSt. Kitts and NevisSt. LuciaSub-Saharan Africa Sub-Saharan Africa (excluding high income)Sub-Saharan Africa (IDA & IBRD countries)SurinameSwazilandSwedenSwitzerlandSyrian Arab RepublicTajikistanTanzaniaThailandTimor-LesteTogoTrinidad and TobagoTunisiaTurkeyUgandaUkraineUnited KingdomUnited StatesUpper middle incomeUruguayVenezuela, RBVietnamWest Bank and GazaWorldYemen, Rep.ZambiaZimbabwe Timeline:
This timeline shows a graph from 1973 to 2015 of Australia. No data until 1972. Number of actual observations by date: 39.
Source name:
World Development Indicators
Source organization:
International Monetary Fund, Government Finance Statistics Yearbook and data files.
Categories, topics:
Public Sector
Last updated:
apr 23, 2017
Indicators value changes by year
Minimum:
58.325
jan 1, 1973
Maximum:
66.715
jan 1, 2001
At the date of observation
Value
Absolute change
Change from previous value
jan 1, 1973
58.325
+58.325
0.0%
jan 1, 1974
59.003
+0.678
1.16%
jan 1, 1975
61.356
+2.353
3.99%
jan 1, 1976
64.573
+3.216
5.24%
jan 1, 1977
62.871
-1.702
-2.64%
jan 1, 1978
63.219
+0.348
0.55%
jan 1, 1979
63.342
+0.123
0.19%
jan 1, 1980
60.451
-2.891
-4.56%
jan 1, 1981
60.825
+0.374
0.62%
jan 1, 1982
62.185
+1.36
2.24%
jan 1, 1983
63.269
+1.084
1.74%
jan 1, 1984
61.203
-2.066
-3.27%
jan 1, 1985
58.861
-2.342
-3.83%
jan 1, 1986
59.792
+0.931
1.58%
jan 1, 1987
59.42
-0.371
-0.62%
jan 1, 1988
60.644
+1.224
2.06%
jan 1, 1989
61.765
+1.121
1.85%
jan 1, 1990
64.313
+2.548
4.13%
jan 1, 1991
65.057
+0.744
1.16%
jan 1, 1992
66.314
+1.257
1.93%
jan 1, 1993
65.617
-0.697
-1.05%
jan 1, 1994
65.711
+0.094
0.14%
jan 1, 1995
64.042
-1.669
-2.54%
jan 1, 2000
65.505
+1.463
2.28%
jan 1, 2001
66.715
+1.21
1.85%
jan 1, 2002
63.294
-3.422
-5.13%
jan 1, 2003
60.64
-2.654
-4.19%
jan 1, 2004
62.873
+2.233
3.68%
jan 1, 2005
63.496
+0.623
0.99%
jan 1, 2006
65.159
+1.662
2.62%
jan 1, 2007
65.377
+0.218
0.34%
jan 1, 2008
65.852
+0.475
0.73%
jan 1, 2009
66.475
+0.623
0.95%
jan 1, 2010
65.163
-1.312
-1.97%
jan 1, 2011
61.553
-3.61
-5.54%
jan 1, 2012
63.647
+2.093
3.4%
jan 1, 2013
65.334
+1.687
2.65%
jan 1, 2014
64.293
-1.041
-1.59%
jan 1, 2015
63.606
-0.686
-1.07%
Ranking of countries by current statistics by years


Comments: