29
/
en
AIzaSyAYiBZKx7MnpbEhh9jyipgxe19OcubqV5w
April 1, 2024
155394
India
IND
true
2
1
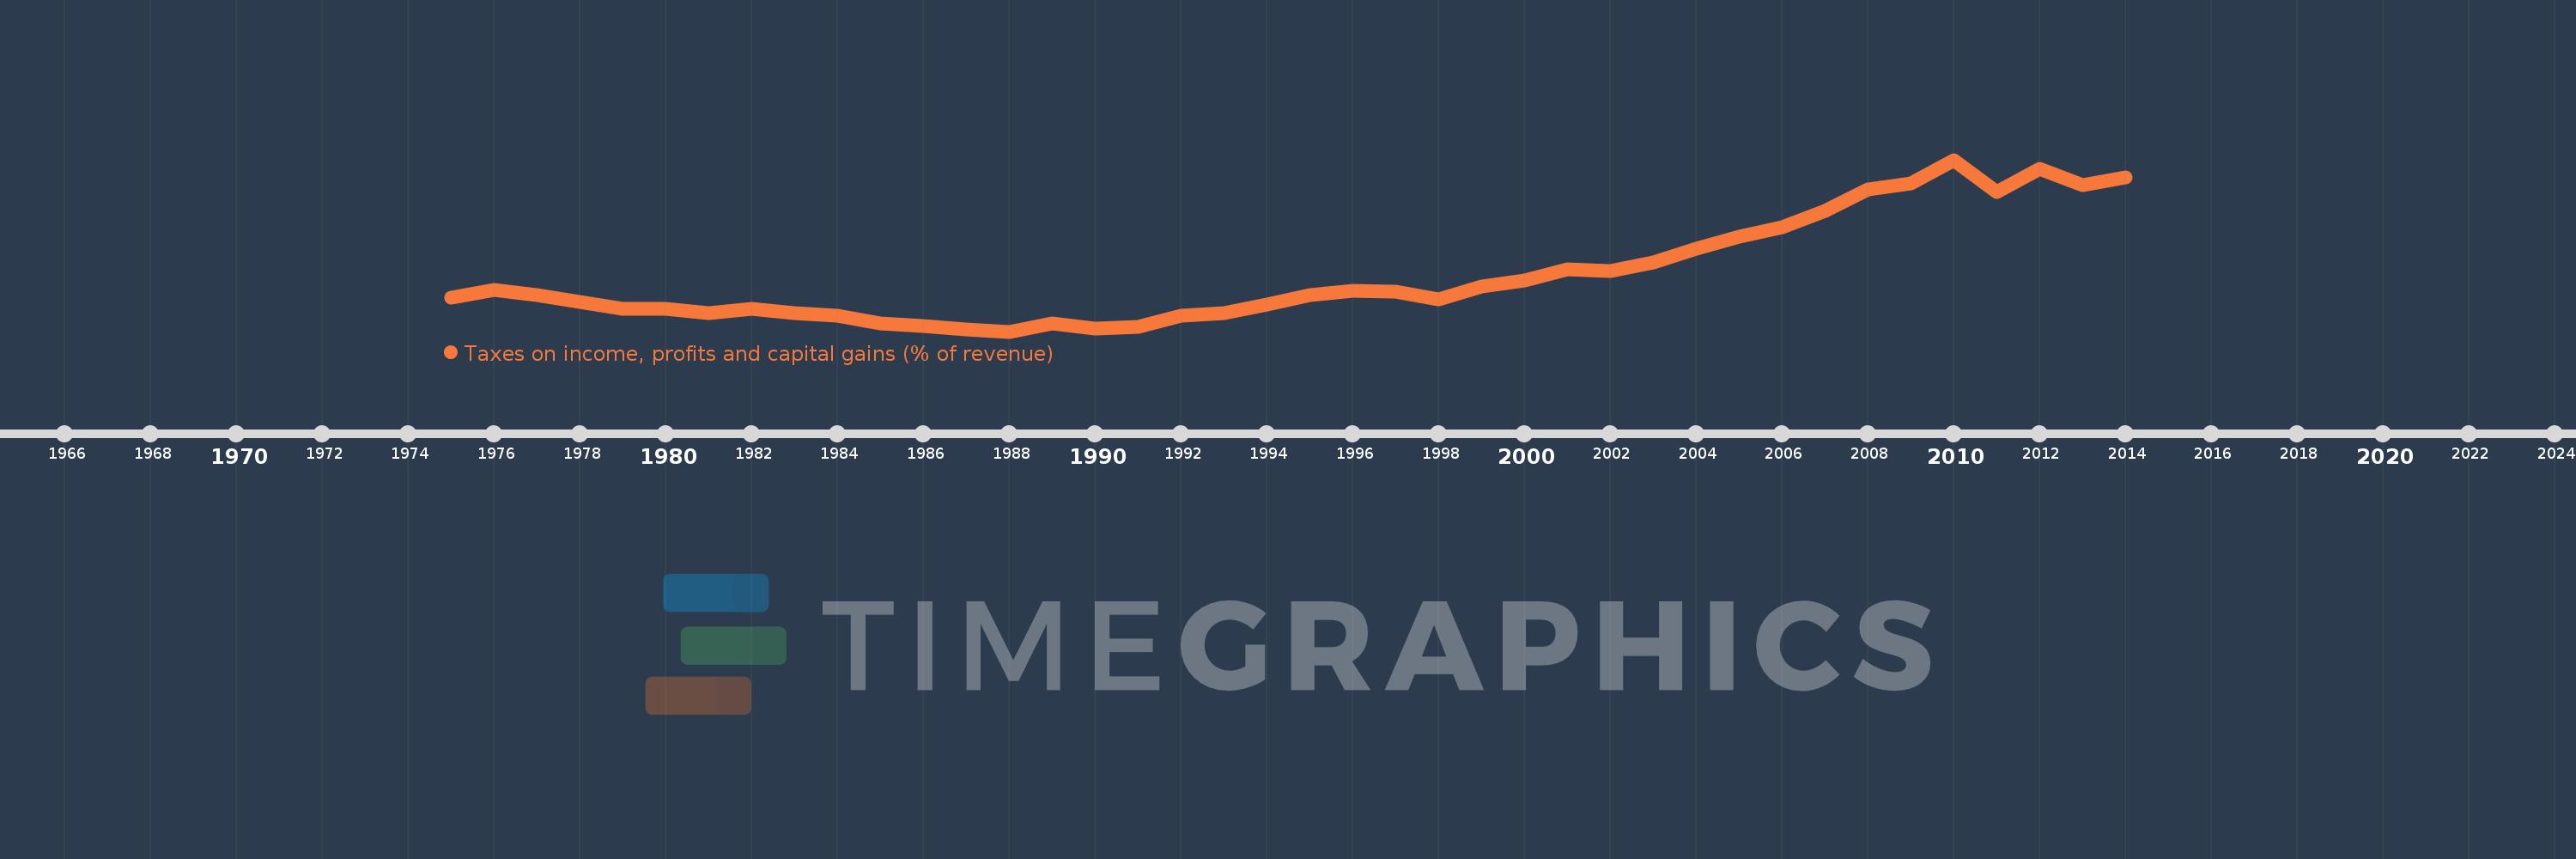
Taxes on income, profits and capital gains (% of revenue)
2014,2013,2012,2011,2010,2009,2008,2007,2006,2005,2004,2003,2002,2001,2000,1999,1998,1997,1996,1995,1994,1993,1992,1991,1990,1989,1988,1987,1986,1985,1984,1983,1982,1981,1980,1979,1978,1977,1976,1975
This statistics in other country:
AfghanistanAlbaniaAlgeriaAngolaAntigua and BarbudaArab WorldArgentinaArmeniaAustraliaAustriaAzerbaijanBahrainBangladeshBarbadosBelarusBelgiumBelizeBeninBhutanBoliviaBosnia and HerzegovinaBotswanaBrazilBulgariaBurkina FasoBurundiCabo VerdeCambodiaCanadaCaribbean small statesCentral African RepublicCentral Europe and the BalticsChileChinaColombiaCongo, Dem. Rep.Congo, Rep.Costa RicaCote d'IvoireCroatiaCyprusCzech RepublicDenmarkDominicaDominican RepublicEarly-demographic dividendEast Asia & PacificEast Asia & Pacific (excluding high income)East Asia & Pacific (IDA & IBRD countries)Egypt, Arab Rep.El SalvadorEquatorial GuineaEstoniaEthiopiaEuro areaEurope & Central AsiaEurope & Central Asia (excluding high income)Europe & Central Asia (IDA & IBRD countries)European UnionFijiFinlandFranceGambia, TheGeorgiaGermanyGhanaGreeceGrenadaGuatemalaHeavily indebted poor countries (HIPC)High incomeHondurasHong Kong SAR, ChinaHungaryIBRD onlyIcelandIDA & IBRD totalIDA blendIDA onlyIDA totalIndiaIndonesiaIran, Islamic Rep.IraqIrelandIsraelItalyJamaicaJapanJordanKazakhstanKenyaKiribatiKorea, Rep.KuwaitKyrgyz RepublicLao PDRLate-demographic dividendLatin America & Caribbean Latin America & Caribbean (excluding high income)Latin America & the Caribbean (IDA & IBRD countries)LatviaLeast developed countries: UN classificationLebanonLesothoLiberiaLithuaniaLow & middle incomeLow incomeLower middle incomeLuxembourgMacao SAR, ChinaMacedonia, FYRMadagascarMalawiMalaysiaMaldivesMaliMaltaMauritiusMexicoMicronesia, Fed. Sts.Middle East & North AfricaMiddle East & North Africa (excluding high income)Middle East & North Africa (IDA & IBRD countries)Middle incomeMoldovaMongoliaMoroccoMozambiqueMyanmarNamibiaNepalNetherlandsNew ZealandNicaraguaNigeriaNorth AmericaNorwayOECD membersOmanOther small statesPakistanPanamaPapua New GuineaParaguayPeruPhilippinesPolandPortugalPost-demographic dividendPre-demographic dividendQatarRomaniaRussian FederationRwandaSamoaSan MarinoSao Tome and PrincipeSenegalSerbiaSeychellesSierra LeoneSingaporeSlovak RepublicSloveniaSmall statesSolomon IslandsSouth AfricaSouth AsiaSouth Asia (IDA & IBRD)SpainSri LankaSt. Kitts and NevisSt. LuciaSub-Saharan Africa Sub-Saharan Africa (excluding high income)Sub-Saharan Africa (IDA & IBRD countries)SurinameSwazilandSwedenSwitzerlandSyrian Arab RepublicTajikistanTanzaniaThailandTimor-LesteTogoTrinidad and TobagoTunisiaTurkeyUgandaUkraineUnited KingdomUnited StatesUpper middle incomeUruguayVenezuela, RBVietnamWest Bank and GazaWorldYemen, Rep.ZambiaZimbabwe Timeline:
This timeline shows a graph from 1975 to 2014 of India. No data until 1974. Number of actual observations by date: 40.
Source name:
World Development Indicators
Source organization:
International Monetary Fund, Government Finance Statistics Yearbook and data files.
Categories, topics:
Public Sector
Last updated:
apr 23, 2017
Indicators value changes by year
Minimum:
13.874
jan 1, 1988
Maximum:
50.271
jan 1, 2010
At the date of observation
Value
Absolute change
Change from previous value
jan 1, 1975
21.034
+21.034
0.0%
jan 1, 1976
22.789
+1.756
8.35%
jan 1, 1977
21.591
-1.198
-5.26%
jan 1, 1978
20.239
-1.352
-6.26%
jan 1, 1979
18.745
-1.494
-7.38%
jan 1, 1980
18.684
-0.061
-0.33%
jan 1, 1981
17.772
-0.912
-4.88%
jan 1, 1982
18.744
+0.972
5.47%
jan 1, 1983
17.794
-0.95
-5.07%
jan 1, 1984
17.155
-0.639
-3.59%
jan 1, 1985
15.674
-1.48
-8.63%
jan 1, 1986
15.035
-0.639
-4.08%
jan 1, 1987
14.376
-0.659
-4.38%
jan 1, 1988
13.874
-0.502
-3.49%
jan 1, 1989
15.514
+1.639
11.82%
jan 1, 1990
14.465
-1.048
-6.76%
jan 1, 1991
14.838
+0.373
2.58%
jan 1, 1992
17.257
+2.419
16.3%
jan 1, 1993
17.771
+0.514
2.98%
jan 1, 1994
19.605
+1.834
10.32%
jan 1, 1995
21.623
+2.017
10.29%
jan 1, 1996
22.506
+0.883
4.08%
jan 1, 1997
22.405
-0.1
-0.44%
jan 1, 1998
20.621
-1.784
-7.96%
jan 1, 1999
23.514
+2.893
14.03%
jan 1, 2000
24.619
+1.105
4.7%
jan 1, 2001
27.014
+2.395
9.73%
jan 1, 2002
26.734
-0.28
-1.04%
jan 1, 2003
28.454
+1.72
6.43%
jan 1, 2004
31.502
+3.048
10.71%
jan 1, 2005
34.068
+2.566
8.14%
jan 1, 2006
35.934
+1.866
5.48%
jan 1, 2007
39.498
+3.565
9.92%
jan 1, 2008
43.921
+4.423
11.2%
jan 1, 2009
45.228
+1.307
2.98%
jan 1, 2010
50.271
+5.043
11.15%
jan 1, 2011
43.385
-6.886
-13.7%
jan 1, 2012
48.384
+5.0
11.52%
jan 1, 2013
44.839
-3.545
-7.33%
jan 1, 2014
46.579
+1.74
3.88%
Ranking of countries by current statistics by years


Comments: