29
/
en
AIzaSyAYiBZKx7MnpbEhh9jyipgxe19OcubqV5w
April 1, 2024
161047
Israel
ISR
true
2
1
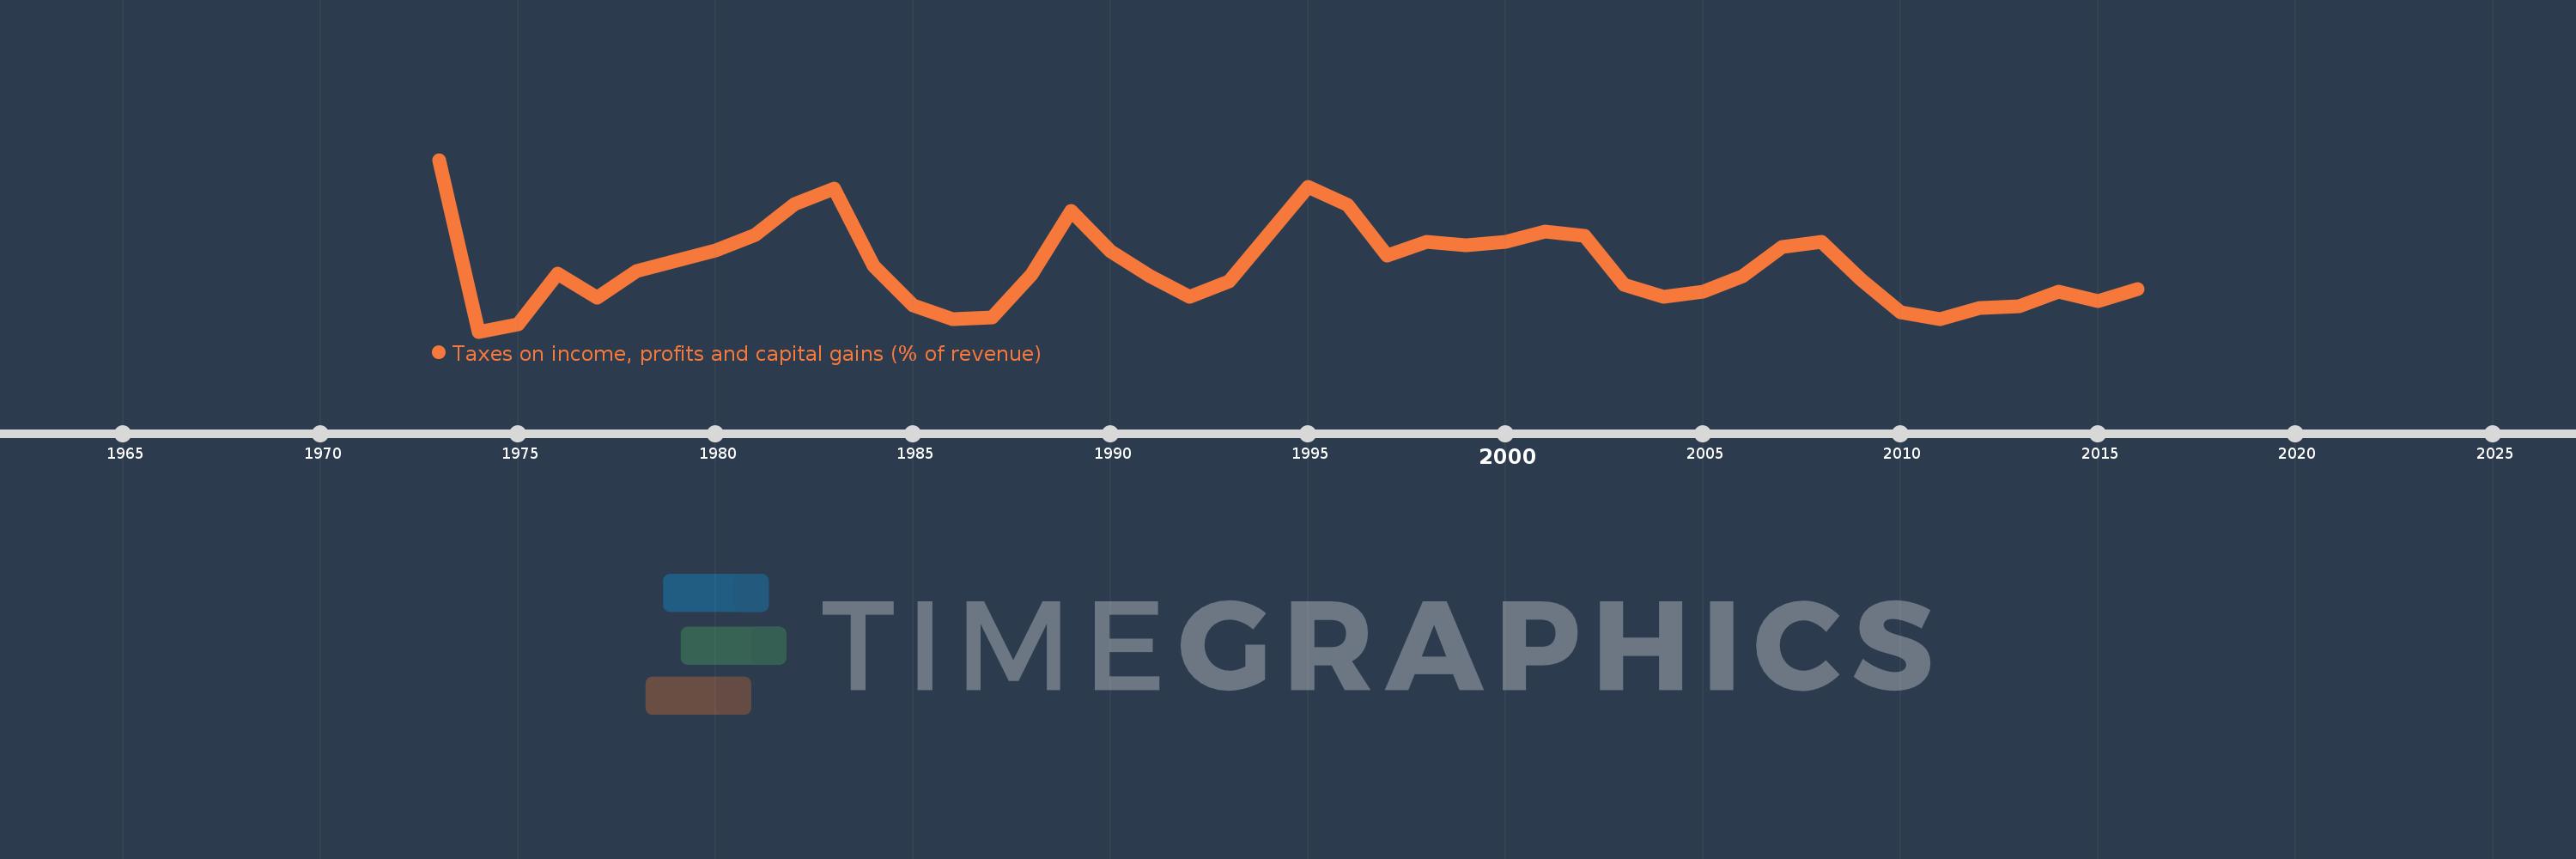
Taxes on income, profits and capital gains (% of revenue)
2016,2015,2014,2013,2012,2011,2010,2009,2008,2007,2006,2005,2004,2003,2002,2001,2000,1999,1998,1997,1996,1995,1994,1993,1992,1991,1990,1989,1988,1987,1986,1985,1984,1983,1982,1981,1980,1979,1978,1977,1976,1975,1974,1973
This statistics in other country:
AfghanistanAlbaniaAlgeriaAngolaAntigua and BarbudaArab WorldArgentinaArmeniaAustraliaAustriaAzerbaijanBahrainBangladeshBarbadosBelarusBelgiumBelizeBeninBhutanBoliviaBosnia and HerzegovinaBotswanaBrazilBulgariaBurkina FasoBurundiCabo VerdeCambodiaCanadaCaribbean small statesCentral African RepublicCentral Europe and the BalticsChileChinaColombiaCongo, Dem. Rep.Congo, Rep.Costa RicaCote d'IvoireCroatiaCyprusCzech RepublicDenmarkDominicaDominican RepublicEarly-demographic dividendEast Asia & PacificEast Asia & Pacific (excluding high income)East Asia & Pacific (IDA & IBRD countries)Egypt, Arab Rep.El SalvadorEquatorial GuineaEstoniaEthiopiaEuro areaEurope & Central AsiaEurope & Central Asia (excluding high income)Europe & Central Asia (IDA & IBRD countries)European UnionFijiFinlandFranceGambia, TheGeorgiaGermanyGhanaGreeceGrenadaGuatemalaHeavily indebted poor countries (HIPC)High incomeHondurasHong Kong SAR, ChinaHungaryIBRD onlyIcelandIDA & IBRD totalIDA blendIDA onlyIDA totalIndiaIndonesiaIran, Islamic Rep.IraqIrelandIsraelItalyJamaicaJapanJordanKazakhstanKenyaKiribatiKorea, Rep.KuwaitKyrgyz RepublicLao PDRLate-demographic dividendLatin America & Caribbean Latin America & Caribbean (excluding high income)Latin America & the Caribbean (IDA & IBRD countries)LatviaLeast developed countries: UN classificationLebanonLesothoLiberiaLithuaniaLow & middle incomeLow incomeLower middle incomeLuxembourgMacao SAR, ChinaMacedonia, FYRMadagascarMalawiMalaysiaMaldivesMaliMaltaMauritiusMexicoMicronesia, Fed. Sts.Middle East & North AfricaMiddle East & North Africa (excluding high income)Middle East & North Africa (IDA & IBRD countries)Middle incomeMoldovaMongoliaMoroccoMozambiqueMyanmarNamibiaNepalNetherlandsNew ZealandNicaraguaNigeriaNorth AmericaNorwayOECD membersOmanOther small statesPakistanPanamaPapua New GuineaParaguayPeruPhilippinesPolandPortugalPost-demographic dividendPre-demographic dividendQatarRomaniaRussian FederationRwandaSamoaSan MarinoSao Tome and PrincipeSenegalSerbiaSeychellesSierra LeoneSingaporeSlovak RepublicSloveniaSmall statesSolomon IslandsSouth AfricaSouth AsiaSouth Asia (IDA & IBRD)SpainSri LankaSt. Kitts and NevisSt. LuciaSub-Saharan Africa Sub-Saharan Africa (excluding high income)Sub-Saharan Africa (IDA & IBRD countries)SurinameSwazilandSwedenSwitzerlandSyrian Arab RepublicTajikistanTanzaniaThailandTimor-LesteTogoTrinidad and TobagoTunisiaTurkeyUgandaUkraineUnited KingdomUnited StatesUpper middle incomeUruguayVenezuela, RBVietnamWest Bank and GazaWorldYemen, Rep.ZambiaZimbabwe Timeline:
This timeline shows a graph from 1973 to 2016 of Israel. No data until 1972. Number of actual observations by date: 44.
Source name:
World Development Indicators
Source organization:
International Monetary Fund, Government Finance Statistics Yearbook and data files.
Categories, topics:
Public Sector
Last updated:
apr 23, 2017
Indicators value changes by year
Minimum:
26.316
jan 1, 1974
At the date of observation
Value
Absolute change
Change from previous value
jan 1, 1973
40.0
+40.0
0.0%
jan 1, 1974
26.316
-13.684
-34.21%
jan 1, 1975
26.923
+0.607
2.31%
jan 1, 1976
30.952
+4.029
14.97%
jan 1, 1977
29.032
-1.92
-6.2%
jan 1, 1978
31.111
+2.079
7.16%
jan 1, 1979
31.944
+0.833
2.68%
jan 1, 1980
32.787
+0.842
2.64%
jan 1, 1981
34.003
+1.216
3.71%
jan 1, 1982
36.456
+2.453
7.21%
jan 1, 1983
37.677
+1.221
3.35%
jan 1, 1984
31.562
-6.115
-16.23%
jan 1, 1985
28.434
-3.128
-9.91%
jan 1, 1986
27.284
-1.15
-4.04%
jan 1, 1987
27.443
+0.159
0.58%
jan 1, 1988
30.869
+3.426
12.49%
jan 1, 1989
35.926
+5.057
16.38%
jan 1, 1990
32.727
-3.199
-8.91%
jan 1, 1991
30.748
-1.979
-6.05%
jan 1, 1992
29.092
-1.657
-5.39%
jan 1, 1993
30.328
+1.236
4.25%
jan 1, 1994
34.075
+3.747
12.36%
jan 1, 1995
37.854
+3.779
11.09%
jan 1, 1996
36.387
-1.468
-3.88%
jan 1, 1997
32.357
-4.029
-11.07%
jan 1, 1998
33.446
+1.089
3.37%
jan 1, 1999
33.211
-0.236
-0.7%
jan 1, 2000
33.468
+0.257
0.77%
jan 1, 2001
34.273
+0.806
2.41%
jan 1, 2002
33.938
-0.335
-0.98%
jan 1, 2003
30.07
-3.868
-11.4%
jan 1, 2004
29.111
-0.959
-3.19%
jan 1, 2005
29.483
+0.372
1.28%
jan 1, 2006
30.699
+1.215
4.12%
jan 1, 2007
33.024
+2.326
7.58%
jan 1, 2008
33.471
+0.447
1.35%
jan 1, 2009
30.449
-3.022
-9.03%
jan 1, 2010
27.877
-2.572
-8.45%
jan 1, 2011
27.337
-0.539
-1.93%
jan 1, 2012
28.17
+0.833
3.05%
jan 1, 2013
28.325
+0.155
0.55%
jan 1, 2014
29.518
+1.193
4.21%
jan 1, 2015
28.779
-0.739
-2.5%
jan 1, 2016
29.699
+0.92
3.2%
Ranking of countries by current statistics by years


Comments: