29
/
en
AIzaSyAYiBZKx7MnpbEhh9jyipgxe19OcubqV5w
April 1, 2024
134651
France
FRA
true
2
1
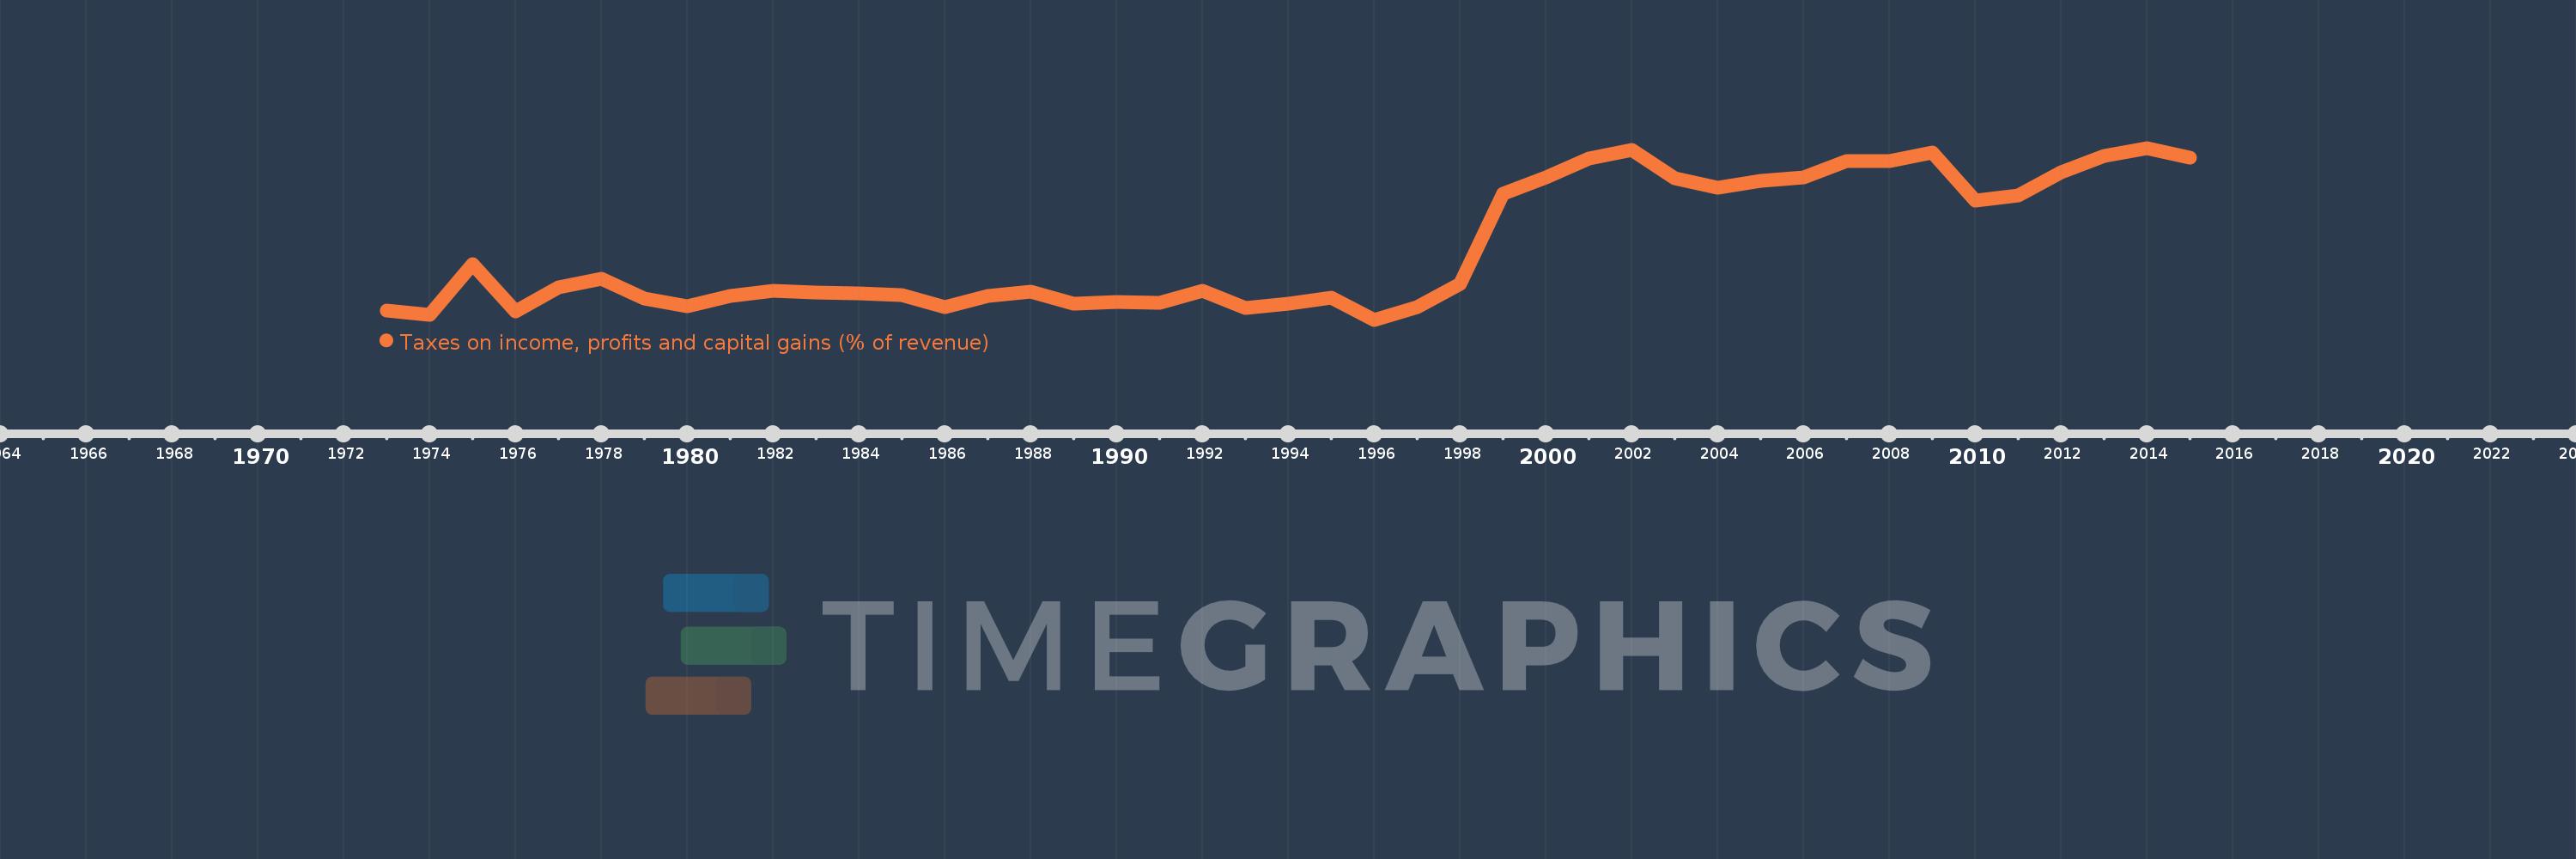
Taxes on income, profits and capital gains (% of revenue)
2015,2014,2013,2012,2011,2010,2009,2008,2007,2006,2005,2004,2003,2002,2001,2000,1999,1998,1997,1996,1995,1994,1993,1992,1991,1990,1989,1988,1987,1986,1985,1984,1983,1982,1981,1980,1979,1978,1977,1976,1975,1974,1973
This statistics in other country:
AfghanistanAlbaniaAlgeriaAngolaAntigua and BarbudaArab WorldArgentinaArmeniaAustraliaAustriaAzerbaijanBahrainBangladeshBarbadosBelarusBelgiumBelizeBeninBhutanBoliviaBosnia and HerzegovinaBotswanaBrazilBulgariaBurkina FasoBurundiCabo VerdeCambodiaCanadaCaribbean small statesCentral African RepublicCentral Europe and the BalticsChileChinaColombiaCongo, Dem. Rep.Congo, Rep.Costa RicaCote d'IvoireCroatiaCyprusCzech RepublicDenmarkDominicaDominican RepublicEarly-demographic dividendEast Asia & PacificEast Asia & Pacific (excluding high income)East Asia & Pacific (IDA & IBRD countries)Egypt, Arab Rep.El SalvadorEquatorial GuineaEstoniaEthiopiaEuro areaEurope & Central AsiaEurope & Central Asia (excluding high income)Europe & Central Asia (IDA & IBRD countries)European UnionFijiFinlandFranceGambia, TheGeorgiaGermanyGhanaGreeceGrenadaGuatemalaHeavily indebted poor countries (HIPC)High incomeHondurasHong Kong SAR, ChinaHungaryIBRD onlyIcelandIDA & IBRD totalIDA blendIDA onlyIDA totalIndiaIndonesiaIran, Islamic Rep.IraqIrelandIsraelItalyJamaicaJapanJordanKazakhstanKenyaKiribatiKorea, Rep.KuwaitKyrgyz RepublicLao PDRLate-demographic dividendLatin America & Caribbean Latin America & Caribbean (excluding high income)Latin America & the Caribbean (IDA & IBRD countries)LatviaLeast developed countries: UN classificationLebanonLesothoLiberiaLithuaniaLow & middle incomeLow incomeLower middle incomeLuxembourgMacao SAR, ChinaMacedonia, FYRMadagascarMalawiMalaysiaMaldivesMaliMaltaMauritiusMexicoMicronesia, Fed. Sts.Middle East & North AfricaMiddle East & North Africa (excluding high income)Middle East & North Africa (IDA & IBRD countries)Middle incomeMoldovaMongoliaMoroccoMozambiqueMyanmarNamibiaNepalNetherlandsNew ZealandNicaraguaNigeriaNorth AmericaNorwayOECD membersOmanOther small statesPakistanPanamaPapua New GuineaParaguayPeruPhilippinesPolandPortugalPost-demographic dividendPre-demographic dividendQatarRomaniaRussian FederationRwandaSamoaSan MarinoSao Tome and PrincipeSenegalSerbiaSeychellesSierra LeoneSingaporeSlovak RepublicSloveniaSmall statesSolomon IslandsSouth AfricaSouth AsiaSouth Asia (IDA & IBRD)SpainSri LankaSt. Kitts and NevisSt. LuciaSub-Saharan Africa Sub-Saharan Africa (excluding high income)Sub-Saharan Africa (IDA & IBRD countries)SurinameSwazilandSwedenSwitzerlandSyrian Arab RepublicTajikistanTanzaniaThailandTimor-LesteTogoTrinidad and TobagoTunisiaTurkeyUgandaUkraineUnited KingdomUnited StatesUpper middle incomeUruguayVenezuela, RBVietnamWest Bank and GazaWorldYemen, Rep.ZambiaZimbabwe Timeline:
This timeline shows a graph from 1973 to 2015 of France. No data until 1972. Number of actual observations by date: 43.
Source name:
World Development Indicators
Source organization:
International Monetary Fund, Government Finance Statistics Yearbook and data files.
Categories, topics:
Public Sector
Last updated:
apr 23, 2017
Indicators value changes by year
Minimum:
16.177
jan 1, 1996
Maximum:
25.904
jan 1, 2014
At the date of observation
Value
Absolute change
Change from previous value
jan 1, 1973
16.687
+16.687
0.0%
jan 1, 1974
16.439
-0.248
-1.49%
jan 1, 1975
19.301
+2.862
17.41%
jan 1, 1976
16.634
-2.666
-13.81%
jan 1, 1977
17.999
+1.365
8.21%
jan 1, 1978
18.484
+0.484
2.69%
jan 1, 1979
17.385
-1.098
-5.94%
jan 1, 1980
16.941
-0.444
-2.56%
jan 1, 1981
17.531
+0.59
3.48%
jan 1, 1982
17.799
+0.268
1.53%
jan 1, 1983
17.741
-0.059
-0.33%
jan 1, 1984
17.679
-0.062
-0.35%
jan 1, 1985
17.568
-0.111
-0.63%
jan 1, 1986
16.869
-0.699
-3.98%
jan 1, 1987
17.535
+0.667
3.95%
jan 1, 1988
17.756
+0.22
1.26%
jan 1, 1989
17.075
-0.681
-3.84%
jan 1, 1990
17.182
+0.107
0.63%
jan 1, 1991
17.125
-0.057
-0.33%
jan 1, 1992
17.793
+0.669
3.9%
jan 1, 1993
16.86
-0.934
-5.25%
jan 1, 1994
17.073
+0.214
1.27%
jan 1, 1995
17.442
+0.369
2.16%
jan 1, 1996
16.177
-1.265
-7.25%
jan 1, 1997
16.888
+0.711
4.4%
jan 1, 1998
18.222
+1.334
7.9%
jan 1, 1999
23.31
+5.088
27.92%
jan 1, 2000
24.251
+0.941
4.04%
jan 1, 2001
25.313
+1.062
4.38%
jan 1, 2002
25.771
+0.459
1.81%
jan 1, 2003
24.205
-1.566
-6.08%
jan 1, 2004
23.671
-0.534
-2.21%
jan 1, 2005
24.025
+0.355
1.5%
jan 1, 2006
24.24
+0.214
0.89%
jan 1, 2007
25.169
+0.929
3.83%
jan 1, 2008
25.161
-0.008
-0.03%
jan 1, 2009
25.625
+0.464
1.85%
jan 1, 2010
22.93
-2.696
-10.52%
jan 1, 2011
23.199
+0.27
1.18%
jan 1, 2012
24.514
+1.314
5.67%
jan 1, 2013
25.439
+0.925
3.77%
jan 1, 2014
25.904
+0.465
1.83%
jan 1, 2015
25.364
-0.54
-2.09%
Ranking of countries by current statistics by years


Comments: