29
/
en
AIzaSyAYiBZKx7MnpbEhh9jyipgxe19OcubqV5w
April 1, 2024
139822
Germany
DEU
true
2
1
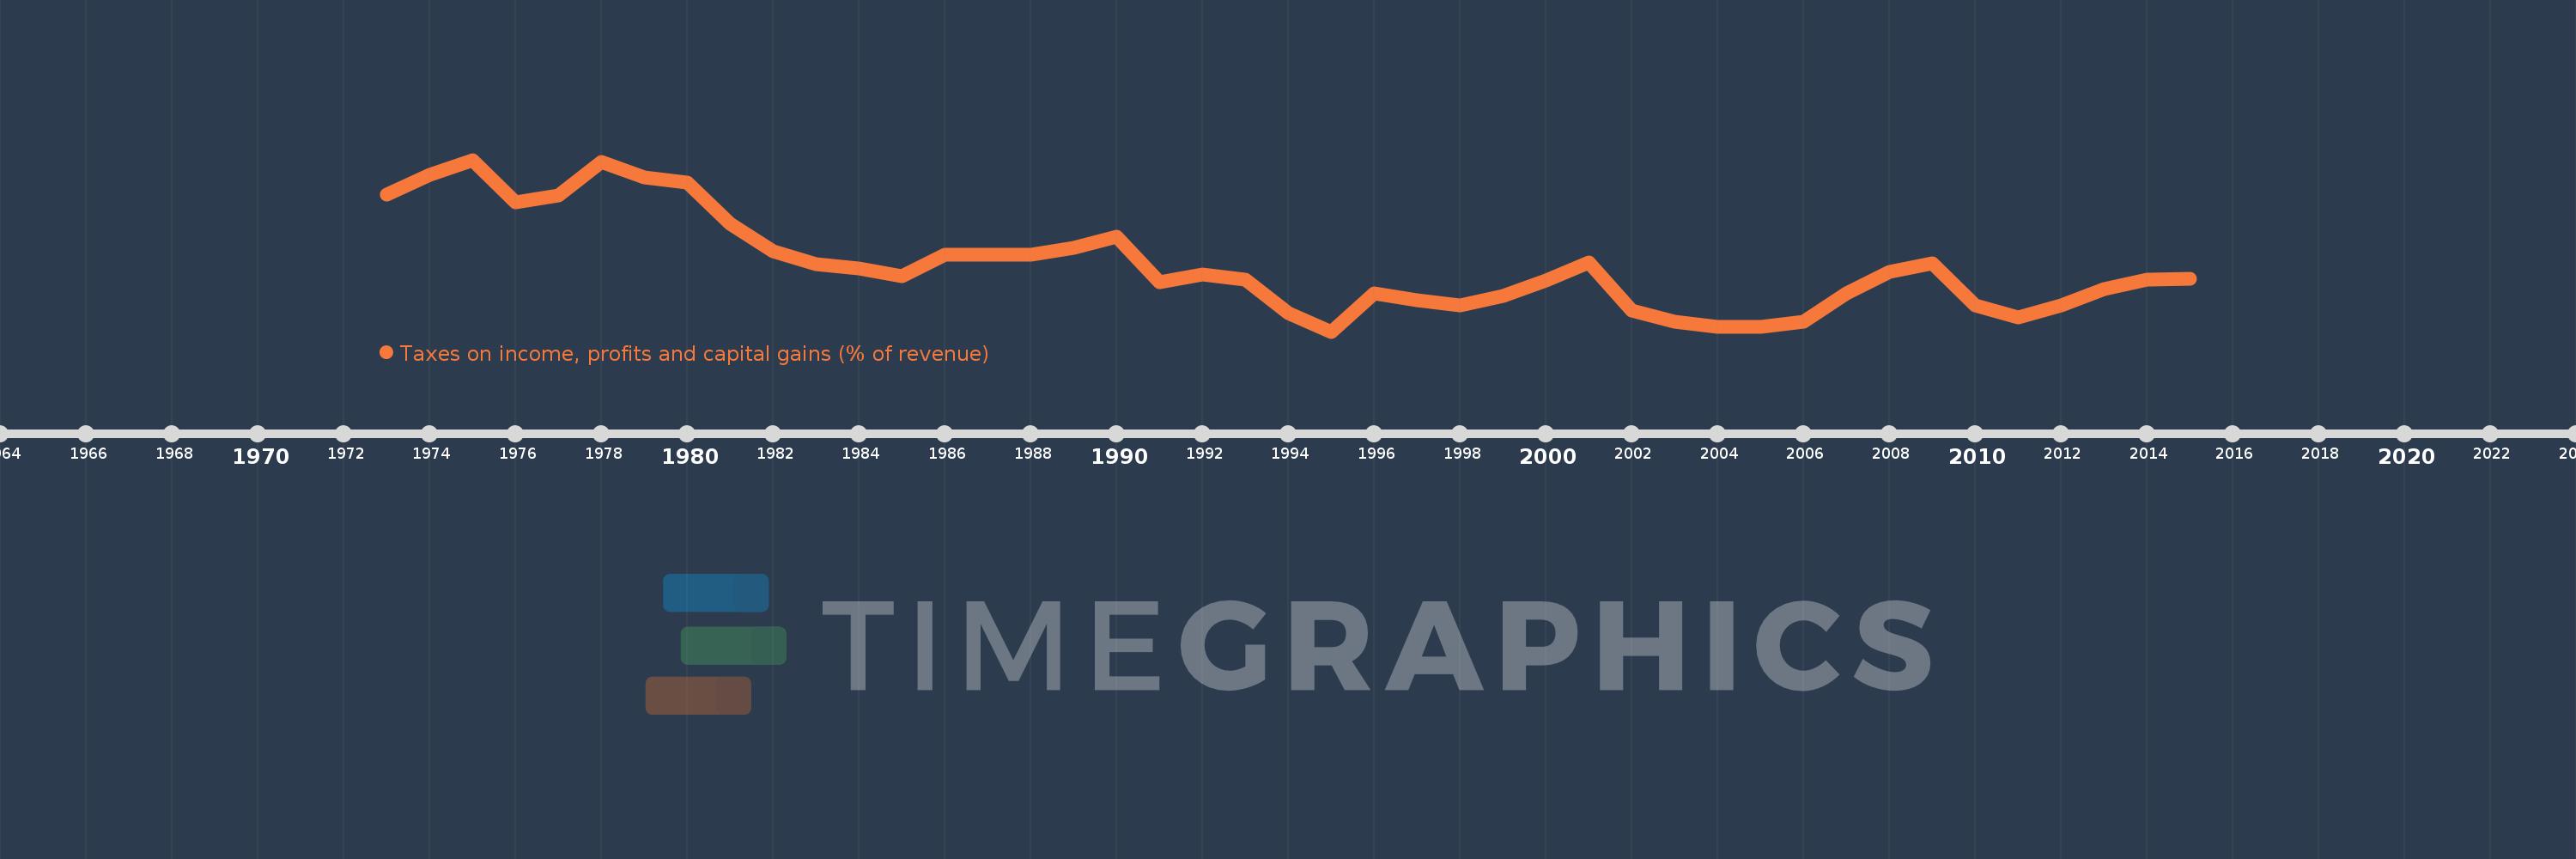
Taxes on income, profits and capital gains (% of revenue)
2015,2014,2013,2012,2011,2010,2009,2008,2007,2006,2005,2004,2003,2002,2001,2000,1999,1998,1997,1996,1995,1994,1993,1992,1991,1990,1989,1988,1987,1986,1985,1984,1983,1982,1981,1980,1979,1978,1977,1976,1975,1974,1973
This statistics in other country:
AfghanistanAlbaniaAlgeriaAngolaAntigua and BarbudaArab WorldArgentinaArmeniaAustraliaAustriaAzerbaijanBahrainBangladeshBarbadosBelarusBelgiumBelizeBeninBhutanBoliviaBosnia and HerzegovinaBotswanaBrazilBulgariaBurkina FasoBurundiCabo VerdeCambodiaCanadaCaribbean small statesCentral African RepublicCentral Europe and the BalticsChileChinaColombiaCongo, Dem. Rep.Congo, Rep.Costa RicaCote d'IvoireCroatiaCyprusCzech RepublicDenmarkDominicaDominican RepublicEarly-demographic dividendEast Asia & PacificEast Asia & Pacific (excluding high income)East Asia & Pacific (IDA & IBRD countries)Egypt, Arab Rep.El SalvadorEquatorial GuineaEstoniaEthiopiaEuro areaEurope & Central AsiaEurope & Central Asia (excluding high income)Europe & Central Asia (IDA & IBRD countries)European UnionFijiFinlandFranceGambia, TheGeorgiaGermanyGhanaGreeceGrenadaGuatemalaHeavily indebted poor countries (HIPC)High incomeHondurasHong Kong SAR, ChinaHungaryIBRD onlyIcelandIDA & IBRD totalIDA blendIDA onlyIDA totalIndiaIndonesiaIran, Islamic Rep.IraqIrelandIsraelItalyJamaicaJapanJordanKazakhstanKenyaKiribatiKorea, Rep.KuwaitKyrgyz RepublicLao PDRLate-demographic dividendLatin America & Caribbean Latin America & Caribbean (excluding high income)Latin America & the Caribbean (IDA & IBRD countries)LatviaLeast developed countries: UN classificationLebanonLesothoLiberiaLithuaniaLow & middle incomeLow incomeLower middle incomeLuxembourgMacao SAR, ChinaMacedonia, FYRMadagascarMalawiMalaysiaMaldivesMaliMaltaMauritiusMexicoMicronesia, Fed. Sts.Middle East & North AfricaMiddle East & North Africa (excluding high income)Middle East & North Africa (IDA & IBRD countries)Middle incomeMoldovaMongoliaMoroccoMozambiqueMyanmarNamibiaNepalNetherlandsNew ZealandNicaraguaNigeriaNorth AmericaNorwayOECD membersOmanOther small statesPakistanPanamaPapua New GuineaParaguayPeruPhilippinesPolandPortugalPost-demographic dividendPre-demographic dividendQatarRomaniaRussian FederationRwandaSamoaSan MarinoSao Tome and PrincipeSenegalSerbiaSeychellesSierra LeoneSingaporeSlovak RepublicSloveniaSmall statesSolomon IslandsSouth AfricaSouth AsiaSouth Asia (IDA & IBRD)SpainSri LankaSt. Kitts and NevisSt. LuciaSub-Saharan Africa Sub-Saharan Africa (excluding high income)Sub-Saharan Africa (IDA & IBRD countries)SurinameSwazilandSwedenSwitzerlandSyrian Arab RepublicTajikistanTanzaniaThailandTimor-LesteTogoTrinidad and TobagoTunisiaTurkeyUgandaUkraineUnited KingdomUnited StatesUpper middle incomeUruguayVenezuela, RBVietnamWest Bank and GazaWorldYemen, Rep.ZambiaZimbabwe Timeline:
This timeline shows a graph from 1973 to 2015 of Germany. No data until 1972. Number of actual observations by date: 43.
Source name:
World Development Indicators
Source organization:
International Monetary Fund, Government Finance Statistics Yearbook and data files.
Categories, topics:
Public Sector
Last updated:
apr 23, 2017
Indicators value changes by year
Minimum:
14.396
jan 1, 1995
At the date of observation
Value
Absolute change
Change from previous value
jan 1, 1973
19.705
+19.705
0.0%
jan 1, 1974
20.445
+0.74
3.75%
jan 1, 1975
21.04
+0.595
2.91%
jan 1, 1976
19.393
-1.647
-7.83%
jan 1, 1977
19.664
+0.271
1.4%
jan 1, 1978
20.962
+1.298
6.6%
jan 1, 1979
20.358
-0.604
-2.88%
jan 1, 1980
20.155
-0.202
-0.99%
jan 1, 1981
18.575
-1.581
-7.84%
jan 1, 1982
17.516
-1.059
-5.7%
jan 1, 1983
17.001
-0.515
-2.94%
jan 1, 1984
16.851
-0.151
-0.89%
jan 1, 1985
16.543
-0.308
-1.83%
jan 1, 1986
17.353
+0.811
4.9%
jan 1, 1987
17.372
+0.019
0.11%
jan 1, 1988
17.364
-0.008
-0.05%
jan 1, 1989
17.638
+0.274
1.58%
jan 1, 1990
18.078
+0.44
2.5%
jan 1, 1991
16.291
-1.787
-9.89%
jan 1, 1992
16.613
+0.322
1.98%
jan 1, 1993
16.394
-0.219
-1.32%
jan 1, 1994
15.121
-1.272
-7.76%
jan 1, 1995
14.396
-0.725
-4.8%
jan 1, 1996
15.876
+1.48
10.28%
jan 1, 1997
15.595
-0.281
-1.77%
jan 1, 1998
15.404
-0.191
-1.23%
jan 1, 1999
15.78
+0.376
2.44%
jan 1, 2000
16.358
+0.578
3.66%
jan 1, 2001
17.082
+0.724
4.43%
jan 1, 2002
15.197
-1.884
-11.03%
jan 1, 2003
14.764
-0.433
-2.85%
jan 1, 2004
14.581
-0.183
-1.24%
jan 1, 2005
14.566
-0.015
-0.1%
jan 1, 2006
14.77
+0.204
1.4%
jan 1, 2007
15.864
+1.093
7.4%
jan 1, 2008
16.72
+0.856
5.4%
jan 1, 2009
17.044
+0.325
1.94%
jan 1, 2010
15.421
-1.623
-9.52%
jan 1, 2011
14.949
-0.471
-3.06%
jan 1, 2012
15.394
+0.445
2.98%
jan 1, 2013
16.054
+0.659
4.28%
jan 1, 2014
16.422
+0.368
2.29%
jan 1, 2015
16.455
+0.034
0.21%
Ranking of countries by current statistics by years


Comments: