29
/
en
AIzaSyAYiBZKx7MnpbEhh9jyipgxe19OcubqV5w
April 1, 2024
125589
Egypt, Arab Rep.
EGY
true
2
1
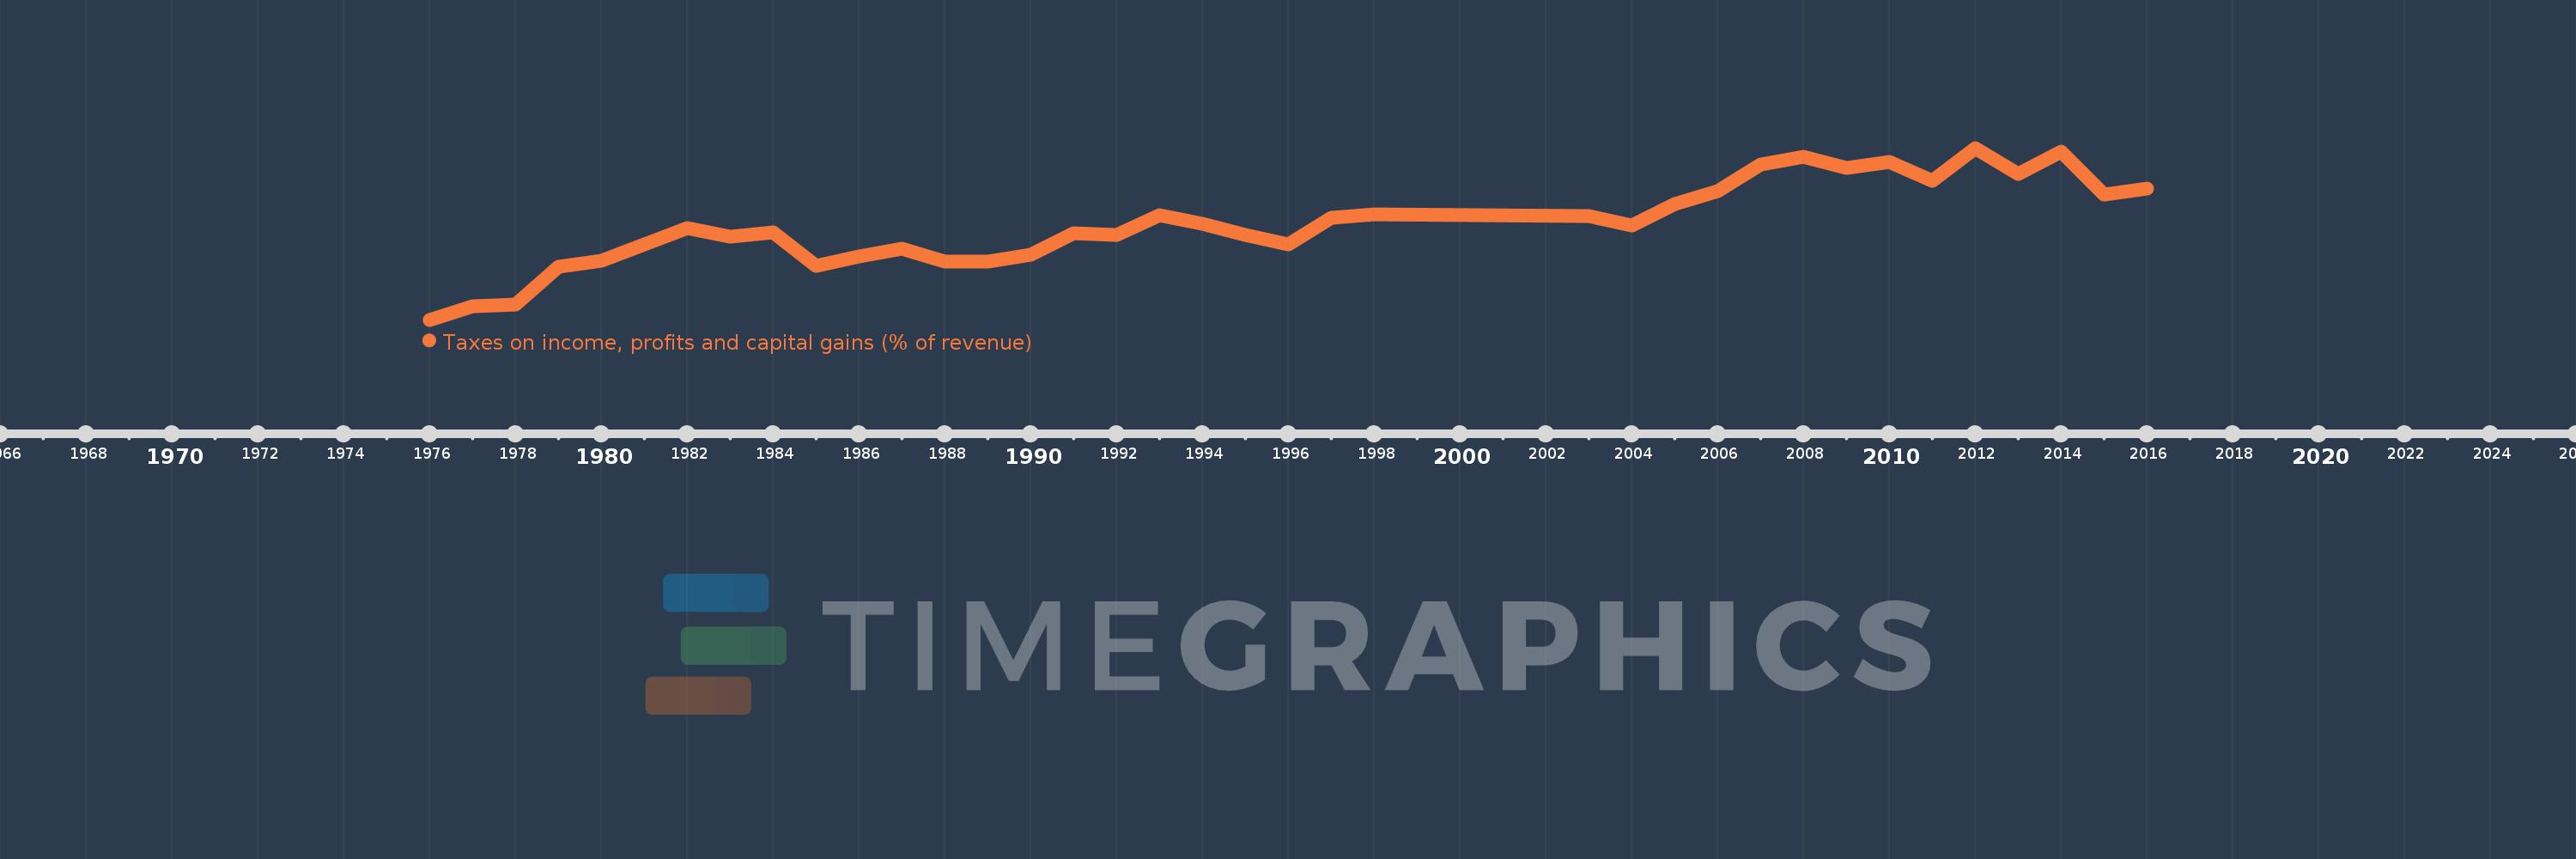
Taxes on income, profits and capital gains (% of revenue)
2016,2015,2014,2013,2012,2011,2010,2009,2008,2007,2006,2005,2004,2003,1998,1997,1996,1995,1994,1993,1992,1991,1990,1989,1988,1987,1986,1985,1984,1983,1982,1980,1979,1978,1977,1976
This statistics in other country:
AfghanistanAlbaniaAlgeriaAngolaAntigua and BarbudaArab WorldArgentinaArmeniaAustraliaAustriaAzerbaijanBahrainBangladeshBarbadosBelarusBelgiumBelizeBeninBhutanBoliviaBosnia and HerzegovinaBotswanaBrazilBulgariaBurkina FasoBurundiCabo VerdeCambodiaCanadaCaribbean small statesCentral African RepublicCentral Europe and the BalticsChileChinaColombiaCongo, Dem. Rep.Congo, Rep.Costa RicaCote d'IvoireCroatiaCyprusCzech RepublicDenmarkDominicaDominican RepublicEarly-demographic dividendEast Asia & PacificEast Asia & Pacific (excluding high income)East Asia & Pacific (IDA & IBRD countries)Egypt, Arab Rep.El SalvadorEquatorial GuineaEstoniaEthiopiaEuro areaEurope & Central AsiaEurope & Central Asia (excluding high income)Europe & Central Asia (IDA & IBRD countries)European UnionFijiFinlandFranceGambia, TheGeorgiaGermanyGhanaGreeceGrenadaGuatemalaHeavily indebted poor countries (HIPC)High incomeHondurasHong Kong SAR, ChinaHungaryIBRD onlyIcelandIDA & IBRD totalIDA blendIDA onlyIDA totalIndiaIndonesiaIran, Islamic Rep.IraqIrelandIsraelItalyJamaicaJapanJordanKazakhstanKenyaKiribatiKorea, Rep.KuwaitKyrgyz RepublicLao PDRLate-demographic dividendLatin America & Caribbean Latin America & Caribbean (excluding high income)Latin America & the Caribbean (IDA & IBRD countries)LatviaLeast developed countries: UN classificationLebanonLesothoLiberiaLithuaniaLow & middle incomeLow incomeLower middle incomeLuxembourgMacao SAR, ChinaMacedonia, FYRMadagascarMalawiMalaysiaMaldivesMaliMaltaMauritiusMexicoMicronesia, Fed. Sts.Middle East & North AfricaMiddle East & North Africa (excluding high income)Middle East & North Africa (IDA & IBRD countries)Middle incomeMoldovaMongoliaMoroccoMozambiqueMyanmarNamibiaNepalNetherlandsNew ZealandNicaraguaNigeriaNorth AmericaNorwayOECD membersOmanOther small statesPakistanPanamaPapua New GuineaParaguayPeruPhilippinesPolandPortugalPost-demographic dividendPre-demographic dividendQatarRomaniaRussian FederationRwandaSamoaSan MarinoSao Tome and PrincipeSenegalSerbiaSeychellesSierra LeoneSingaporeSlovak RepublicSloveniaSmall statesSolomon IslandsSouth AfricaSouth AsiaSouth Asia (IDA & IBRD)SpainSri LankaSt. Kitts and NevisSt. LuciaSub-Saharan Africa Sub-Saharan Africa (excluding high income)Sub-Saharan Africa (IDA & IBRD countries)SurinameSwazilandSwedenSwitzerlandSyrian Arab RepublicTajikistanTanzaniaThailandTimor-LesteTogoTrinidad and TobagoTunisiaTurkeyUgandaUkraineUnited KingdomUnited StatesUpper middle incomeUruguayVenezuela, RBVietnamWest Bank and GazaWorldYemen, Rep.ZambiaZimbabwe Timeline:
This timeline shows a graph from 1976 to 2016 of Egypt, Arab Rep.. No data until 1975. Number of actual observations by date: 36.
Source name:
World Development Indicators
Source organization:
International Monetary Fund, Government Finance Statistics Yearbook and data files.
Categories, topics:
Public Sector
Last updated:
apr 23, 2017
Indicators value changes by year
Maximum:
29.666
jan 1, 2012
At the date of observation
Value
Absolute change
Change from previous value
jan 1, 1976
6.353
+6.353
0.0%
jan 1, 1977
8.21
+1.856
29.21%
jan 1, 1978
8.391
+0.182
2.21%
jan 1, 1979
13.552
+5.161
61.5%
jan 1, 1980
14.348
+0.796
5.87%
jan 1, 1982
18.763
+4.416
30.77%
jan 1, 1983
17.606
-1.157
-6.17%
jan 1, 1984
18.154
+0.547
3.11%
jan 1, 1985
13.672
-4.481
-24.69%
jan 1, 1986
14.934
+1.261
9.23%
jan 1, 1987
15.992
+1.058
7.08%
jan 1, 1988
14.213
-1.778
-11.12%
jan 1, 1989
14.266
+0.053
0.37%
jan 1, 1990
15.192
+0.926
6.49%
jan 1, 1991
18.058
+2.867
18.87%
jan 1, 1992
17.853
-0.205
-1.14%
jan 1, 1993
20.488
+2.635
14.76%
jan 1, 1994
19.387
-1.101
-5.37%
jan 1, 1995
17.81
-1.577
-8.14%
jan 1, 1996
16.626
-1.184
-6.65%
jan 1, 1997
20.245
+3.619
21.77%
jan 1, 1998
20.681
+0.436
2.16%
jan 1, 2003
20.422
-0.26
-1.26%
jan 1, 2004
19.115
-1.306
-6.4%
jan 1, 2005
22.007
+2.891
15.13%
jan 1, 2006
23.751
+1.745
7.93%
jan 1, 2007
27.436
+3.685
15.51%
jan 1, 2008
28.463
+1.027
3.74%
jan 1, 2009
26.949
-1.514
-5.32%
jan 1, 2010
27.814
+0.865
3.21%
jan 1, 2011
25.255
-2.559
-9.2%
jan 1, 2012
29.666
+4.411
17.46%
jan 1, 2013
26.155
-3.511
-11.83%
jan 1, 2014
29.175
+3.02
11.55%
jan 1, 2015
23.289
-5.886
-20.18%
jan 1, 2016
24.113
+0.824
3.54%
Ranking of countries by current statistics by years


Comments: