29
/
en
AIzaSyAYiBZKx7MnpbEhh9jyipgxe19OcubqV5w
April 1, 2024
113043
Costa Rica
CRI
true
2
1
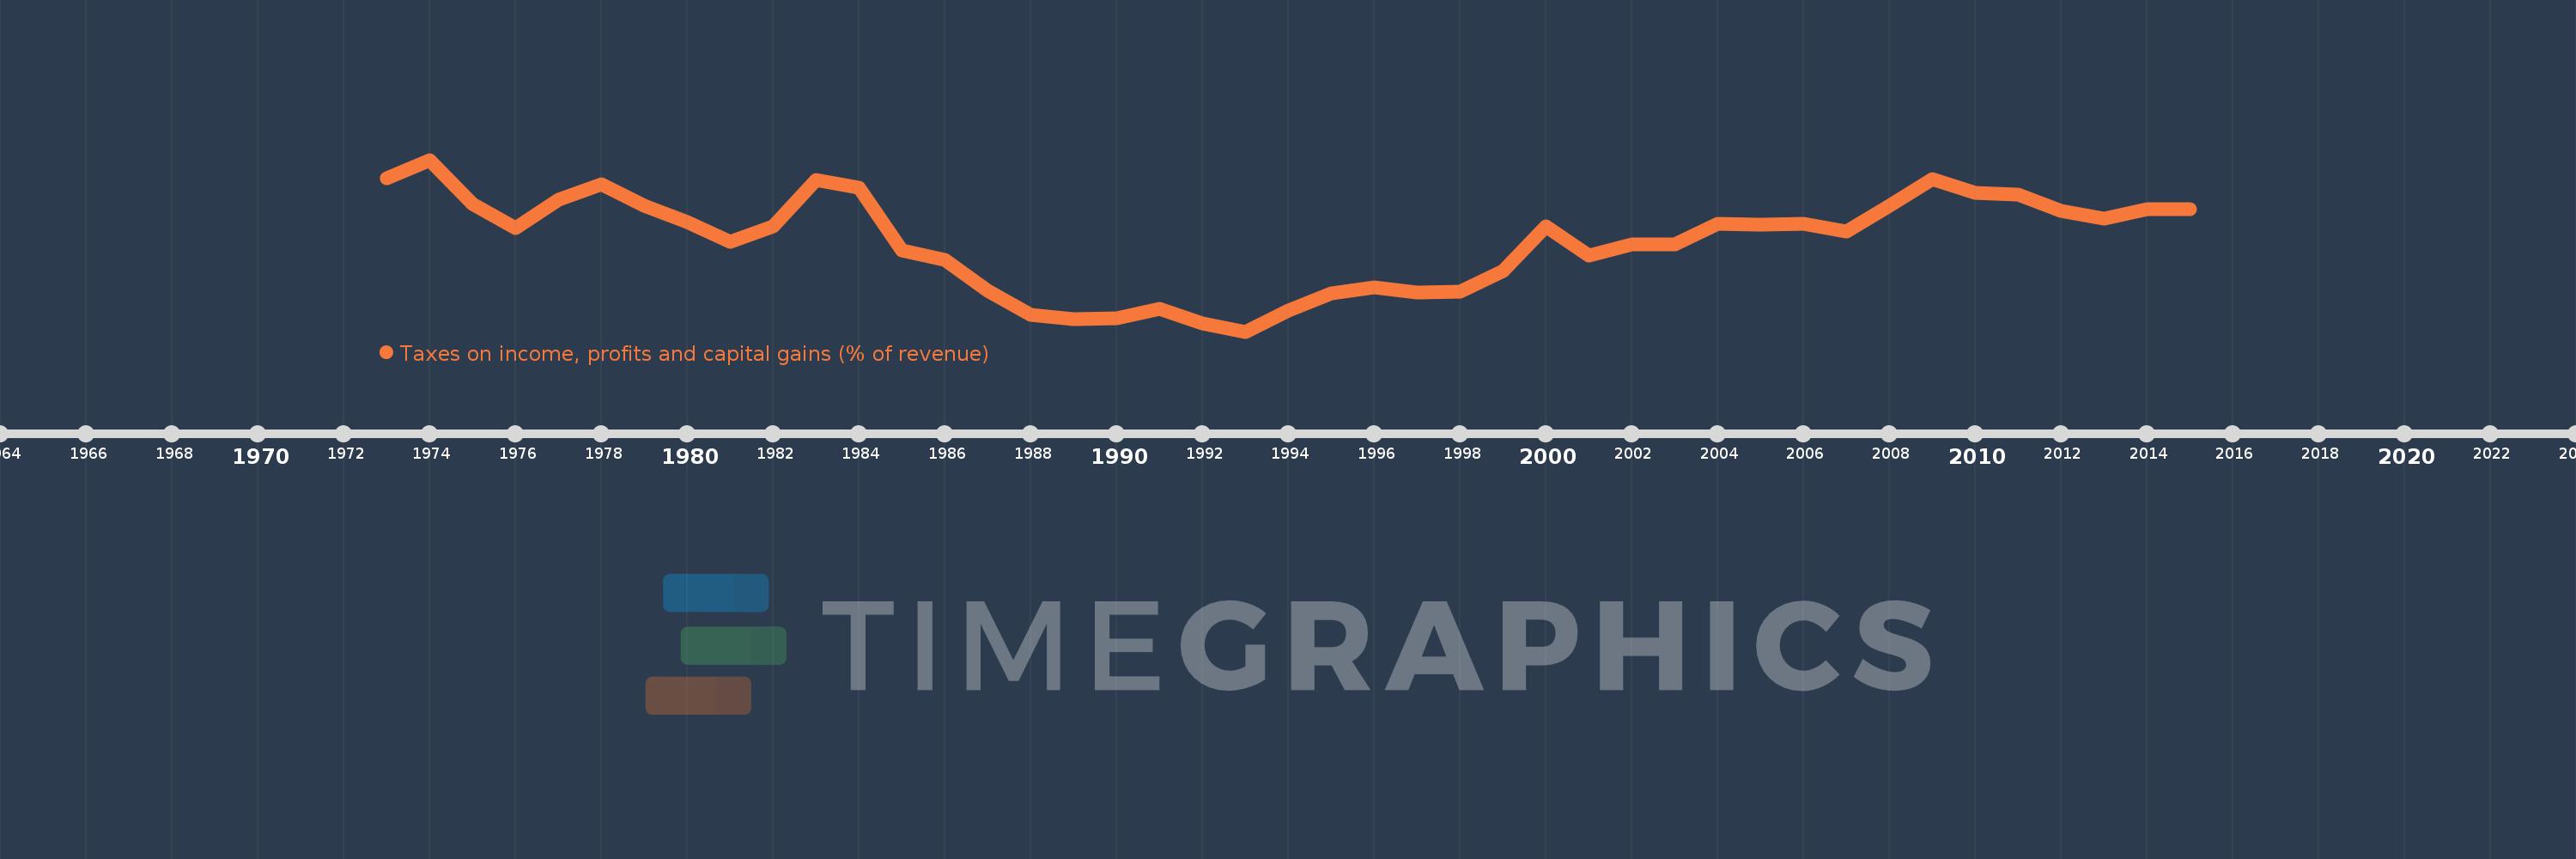
Taxes on income, profits and capital gains (% of revenue)
2015,2014,2013,2012,2011,2010,2009,2008,2007,2006,2005,2004,2003,2002,2001,2000,1999,1998,1997,1996,1995,1994,1993,1992,1991,1990,1989,1988,1987,1986,1985,1984,1983,1982,1981,1980,1979,1978,1977,1976,1975,1974,1973
This statistics in other country:
AfghanistanAlbaniaAlgeriaAngolaAntigua and BarbudaArab WorldArgentinaArmeniaAustraliaAustriaAzerbaijanBahrainBangladeshBarbadosBelarusBelgiumBelizeBeninBhutanBoliviaBosnia and HerzegovinaBotswanaBrazilBulgariaBurkina FasoBurundiCabo VerdeCambodiaCanadaCaribbean small statesCentral African RepublicCentral Europe and the BalticsChileChinaColombiaCongo, Dem. Rep.Congo, Rep.Costa RicaCote d'IvoireCroatiaCyprusCzech RepublicDenmarkDominicaDominican RepublicEarly-demographic dividendEast Asia & PacificEast Asia & Pacific (excluding high income)East Asia & Pacific (IDA & IBRD countries)Egypt, Arab Rep.El SalvadorEquatorial GuineaEstoniaEthiopiaEuro areaEurope & Central AsiaEurope & Central Asia (excluding high income)Europe & Central Asia (IDA & IBRD countries)European UnionFijiFinlandFranceGambia, TheGeorgiaGermanyGhanaGreeceGrenadaGuatemalaHeavily indebted poor countries (HIPC)High incomeHondurasHong Kong SAR, ChinaHungaryIBRD onlyIcelandIDA & IBRD totalIDA blendIDA onlyIDA totalIndiaIndonesiaIran, Islamic Rep.IraqIrelandIsraelItalyJamaicaJapanJordanKazakhstanKenyaKiribatiKorea, Rep.KuwaitKyrgyz RepublicLao PDRLate-demographic dividendLatin America & Caribbean Latin America & Caribbean (excluding high income)Latin America & the Caribbean (IDA & IBRD countries)LatviaLeast developed countries: UN classificationLebanonLesothoLiberiaLithuaniaLow & middle incomeLow incomeLower middle incomeLuxembourgMacao SAR, ChinaMacedonia, FYRMadagascarMalawiMalaysiaMaldivesMaliMaltaMauritiusMexicoMicronesia, Fed. Sts.Middle East & North AfricaMiddle East & North Africa (excluding high income)Middle East & North Africa (IDA & IBRD countries)Middle incomeMoldovaMongoliaMoroccoMozambiqueMyanmarNamibiaNepalNetherlandsNew ZealandNicaraguaNigeriaNorth AmericaNorwayOECD membersOmanOther small statesPakistanPanamaPapua New GuineaParaguayPeruPhilippinesPolandPortugalPost-demographic dividendPre-demographic dividendQatarRomaniaRussian FederationRwandaSamoaSan MarinoSao Tome and PrincipeSenegalSerbiaSeychellesSierra LeoneSingaporeSlovak RepublicSloveniaSmall statesSolomon IslandsSouth AfricaSouth AsiaSouth Asia (IDA & IBRD)SpainSri LankaSt. Kitts and NevisSt. LuciaSub-Saharan Africa Sub-Saharan Africa (excluding high income)Sub-Saharan Africa (IDA & IBRD countries)SurinameSwazilandSwedenSwitzerlandSyrian Arab RepublicTajikistanTanzaniaThailandTimor-LesteTogoTrinidad and TobagoTunisiaTurkeyUgandaUkraineUnited KingdomUnited StatesUpper middle incomeUruguayVenezuela, RBVietnamWest Bank and GazaWorldYemen, Rep.ZambiaZimbabwe Timeline:
This timeline shows a graph from 1973 to 2015 of Costa Rica. No data until 1972. Number of actual observations by date: 43.
Source name:
World Development Indicators
Source organization:
International Monetary Fund, Government Finance Statistics Yearbook and data files.
Categories, topics:
Public Sector
Last updated:
apr 23, 2017
Indicators value changes by year
Maximum:
18.519
jan 1, 1974
At the date of observation
Value
Absolute change
Change from previous value
jan 1, 1973
17.46
+17.46
0.0%
jan 1, 1974
18.519
+1.058
6.06%
jan 1, 1975
15.918
-2.6
-14.04%
jan 1, 1976
14.521
-1.397
-8.78%
jan 1, 1977
16.164
+1.643
11.31%
jan 1, 1978
17.084
+0.92
5.69%
jan 1, 1979
15.826
-1.258
-7.36%
jan 1, 1980
14.873
-0.953
-6.02%
jan 1, 1981
13.686
-1.188
-7.99%
jan 1, 1982
14.622
+0.937
6.84%
jan 1, 1983
17.322
+2.7
18.47%
jan 1, 1984
16.898
-0.424
-2.45%
jan 1, 1985
13.222
-3.676
-21.76%
jan 1, 1986
12.655
-0.566
-4.28%
jan 1, 1987
10.85
-1.805
-14.26%
jan 1, 1988
9.432
-1.418
-13.07%
jan 1, 1989
9.166
-0.267
-2.83%
jan 1, 1990
9.225
+0.06
0.65%
jan 1, 1991
9.793
+0.567
6.15%
jan 1, 1992
8.947
-0.846
-8.64%
jan 1, 1993
8.445
-0.502
-5.61%
jan 1, 1994
9.694
+1.249
14.79%
jan 1, 1995
10.669
+0.974
10.05%
jan 1, 1996
11.036
+0.368
3.45%
jan 1, 1997
10.727
-0.31
-2.81%
jan 1, 1998
10.806
+0.079
0.74%
jan 1, 1999
11.977
+1.171
10.83%
jan 1, 2000
14.609
+2.632
21.97%
jan 1, 2001
12.922
-1.686
-11.54%
jan 1, 2002
13.554
+0.631
4.89%
jan 1, 2003
13.547
-0.007
-0.05%
jan 1, 2004
14.759
+1.212
8.95%
jan 1, 2005
14.729
-0.03
-0.2%
jan 1, 2006
14.781
+0.052
0.35%
jan 1, 2007
14.329
-0.453
-3.06%
jan 1, 2008
15.834
+1.506
10.51%
jan 1, 2009
17.376
+1.542
9.74%
jan 1, 2010
16.577
-0.799
-4.6%
jan 1, 2011
16.497
-0.08
-0.48%
jan 1, 2012
15.536
-0.962
-5.83%
jan 1, 2013
15.071
-0.464
-2.99%
jan 1, 2014
15.622
+0.551
3.65%
jan 1, 2015
15.631
+0.008
0.05%
Ranking of countries by current statistics by years


Comments: